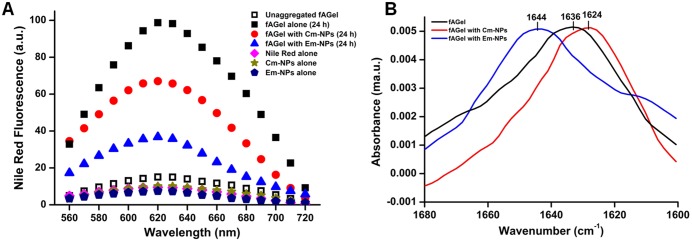
Fig 6. Hydrophobicity and secondary structure assessment of the aggregates.

(A) Nile Red fluorescence of fAGel alone (black squares), with Cm-NPs (red circles) and Em-NPs (blue triangles). The fluorescence spectra of controls are also shown in colour. (B) ATR-FTIR spectra of aggregating samples of fAGel alone (black), with Cm-NPs (red) and with Em-NPs (blue) are compared. In each case the samples were taken after 24 h of incubation with NPs at 0.1 mg/ml concentration. A characteristic 1644 cm-1 peak for Em-NP sample corresponds to majorly unstructured aggregates.
