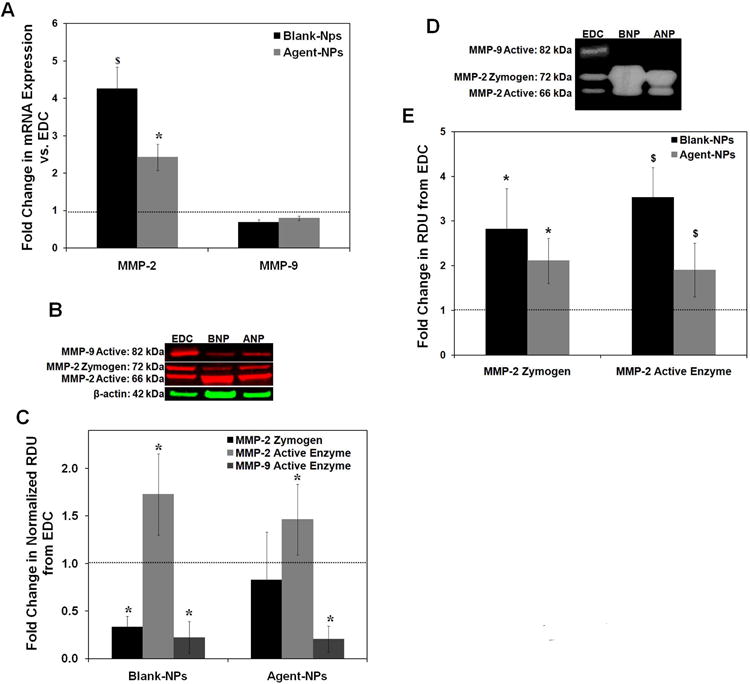
Figure 6.

Effect of NPs on MMP expression and activity by HASMCs. (A) Fold-change in mRNA expression of MMP-2 and -9 compared to exogenous delivery control (EDC). (n = 5 per treatment condition, * denotes p < 0.05 compared to EDC, $ denotes p < 0.05 compared to every treatment condition). (B) Representative western blot image illustrating the synthesis of MMP-2 and -9 by HASMCs within the constructs, with β-actin (loading control). (C) Fold-change in expression of MMP-2 zymogen, and active forms of MMP-2 and -9 compared to exogenous delivery control (EDC; set to unity). (n = 3 per treatment condition; * denotes p < 0.05 compared to EDC). (D) Representative gel zymograms showing the active and zymogen forms of MMP-2 and active form of MMP-9. (E) Fold-change in zymogen and active forms of MMP-2 compared to exogenous delivery control (EDC; set to unity) (n = 3 per treatment condition; * denotes p < 0.05 compared to EDC, $ denotes p < 0.05 compared to every treatment condition).
