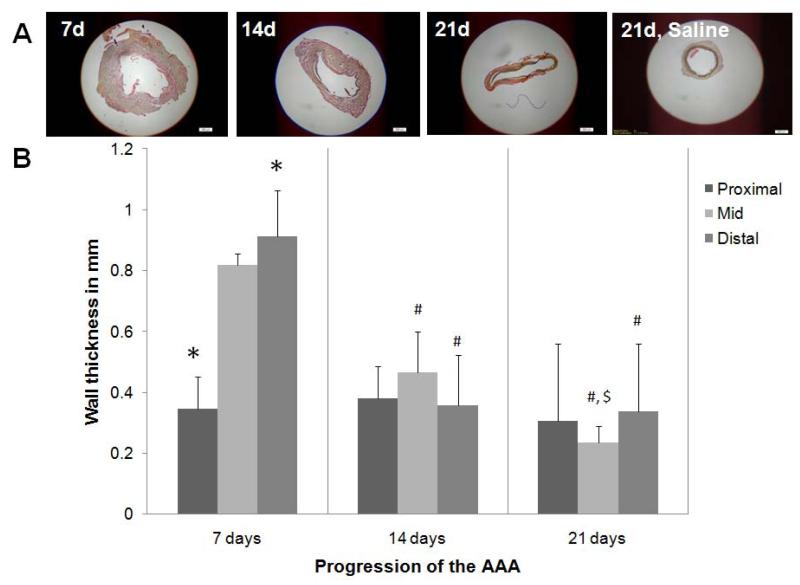
Figure 2.
Change in wall thickness of abdominal aorta with AAA progression. Panel A shows low magnification (2×) images of Movat’s Pentachrome–stained AAA sections, sourced from the region of maximal AAA expansion. AAA wall thickness, quantified from images of the histological sections are shown in Panel B. The data shows an initial increase in wall thickness at 7 days post AAA induction, especially in the mid- and distal-regions, followed by a significant reduction in wall thickness, also in the same regions, at longer post-AAA induction periods. The wall thickness in the proximal region of the AAA remained unchanged with time. *, #, and $ represent significance of differences in diameters relative to the mid region, relative to the same region at 7 days, and relative to the same region at 14 days, respectively, deemed for p < 0.05. Analysis was based on n = 3 images/ region/time point, repeated 3 times. Scale bar is 500 μm. In comparison, the wall thickness of healthy aorta was 0.15 ± 0.06 μm and that of 21 day sham control aortae was 0.25 ± 0.06 μm.

