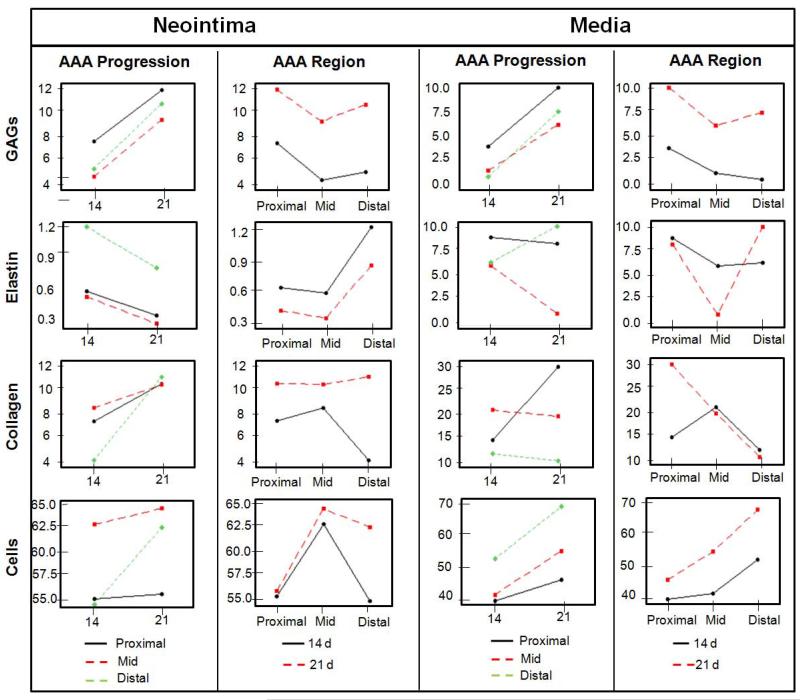
Figure 6.
Simplified illustration of trends showing how AAA progression and spatial regions each influence the prevalence of tissue components. The ‘Y’ axis indicates % area of the certain Field of View (FOV) occupied by each tissue component as determined by image pro based analysis of histological sections.

