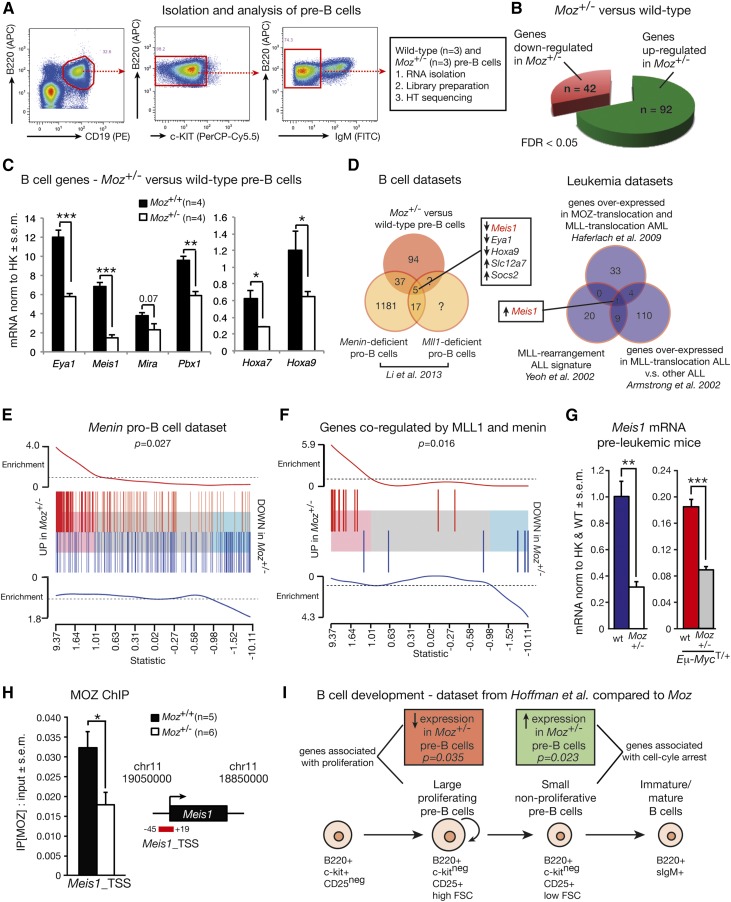
Figure 6.
Gene expression analysis comparing Moz+/− and WT pre–B-cells. (A) Experimental design. (B) Number of differentially expressed genes in Moz+/− vs WT pre–B-cells with a FDR cutoff of 5%. A complete list of genes differentially expressed in Moz+/− vs WT pre–B-cells can be found in supplemental Table 6. (C) Confirmation of reduced levels of Eya1, Meis1, Pbx1, Hoxa7, and Hoxa9 in independent samples of Moz+/− pre–B-cells. (D) Comparison of the Moz+/− pre–B-cell expression profile with other published data sets. The “B-cell data sets” schematic Venn diagram shows an overlap between genes differentially expressed in Moz+/− vs WT pre–B-cells, and in Men1- and Mll-deficient pro–B-cells. The “leukemia data sets” compare genes strongly overexpressed in human MLL-translocation ALL, MLL-translocation AML, and MOZ-translocation AML. (E) Enrichment plot showing a positive correlation between the Men1-deficient pro–B-cell signature from Li et al38 and the Moz+/− expression profile. The horizontal axis shows t-statistics for all genes in the Moz+/− data. Red and blue bars mark positions of genes that are up and down, respectively, in the Men1-knockout experiment. Worms show relative enrichment of the Men1-knockout genes relative to uniform ordering. (F) Enrichment plot showing a positive correlation between the Moz+/− expression profile and the overlap genes from Men1 and Mll knockout pro–B-cells from Li et al.38 (G) Meis1 mRNA expression levels in pre–B-cells from pre-leukemic (4-week-old) mice. (H) Binding of MOZ to the Meis1 locus in Moz+/− and WT pre–B-cells. (I) Comparison of the Moz data set with gene expression profiles of B-cell progenitors at different developmental stages.46 Genes strongly expressed in large proliferative pre–B-cells are reduced in Moz+/− pre–B-cells (red box, Roast P = .035), whereas genes enriched in small resting pre–B-cells are upregulated in Moz+/− pre–B-cells (green box, Roast P = .023). Data are presented as mean ± SEM. For qRT-PCR experiments, gene expression levels were normalized to housekeeping genes Hsp90ab1 and Gapdh (C), or housekeeping genes and expression in WT samples (G). Asterisks shown in (C,G,H) indicate a statistically significant difference between Moz+/− and WT, or between Moz+/−; Eμ-MycT/+ and Moz+/+; Eμ-MycT/+ mice at *P < .05, **P < .01, and ***P < .001. ChIP, chromatin immunoprecipitation; FITC, fluorescein isothiocyanate; FSC, forward scatter; HK, housekeeping genes; HT sequencing, high-throughput sequencing; PE, phycoerythrin.

