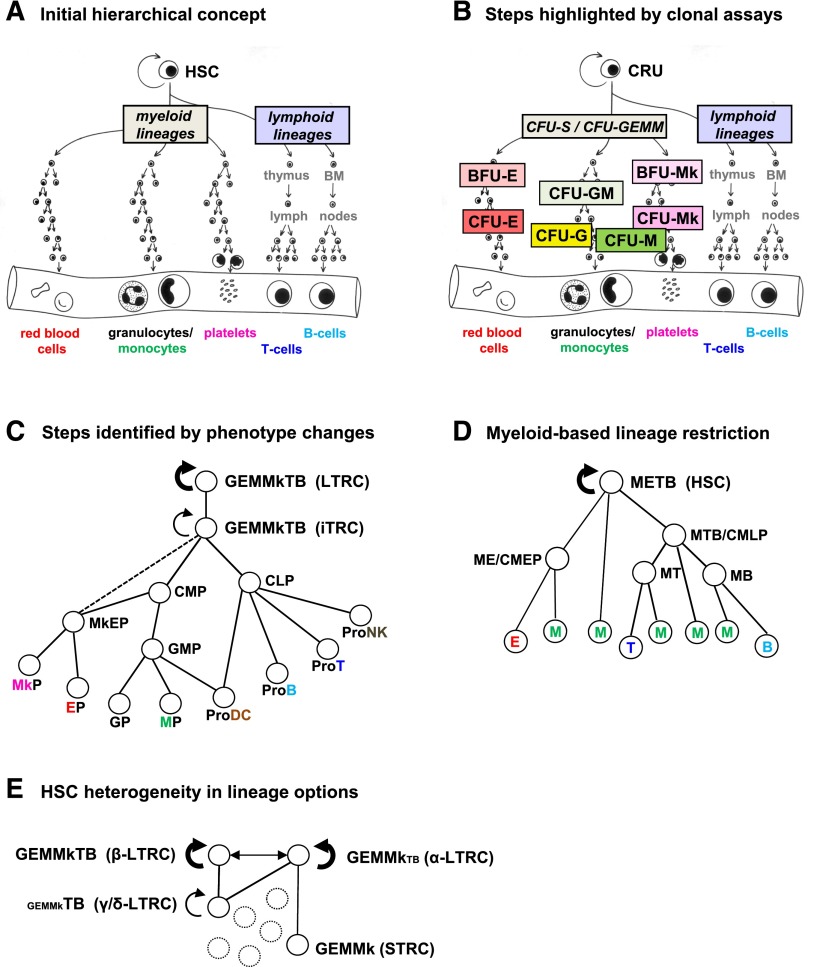
Figure 2.
Hierarchical models of HSC self-renewal and differentiation. Increasingly complex models of HSC differentiation hierarchies reflecting historically changing information about the numbers and types of lineages obtained from single-mouse “HSCs” in various in vitro and in vivo systems. (A) Initial view showing all lymphoid and all myeloid potentialities as the first lineage groupings to be segregated. (B) A more detailed view of the compartmentalization of intermediate, lineage-restricted progenitor subsets based on their behavior in short-term in vitro colony assays and properties allowing their separate isolation. (C) Map of early lineage restriction events based on the predominant functional activities of particular cell phenotypes (redrawn from Figure 1 of Seita and Weissman.38 (D) Concept of multiple origins of GM cells derived from examination of the lymphoid and myeloid activities elicited from different subsets of mouse hematopoietic cells in vitro. The hierarchy shown in this case has been adapted from Figure 1E of Kawamoto et al.107 (E) Differences in lineage potentialities exhibited by LTRCs with durable (serially transplantable) self-renewal activity (HSCs) as reported by Dykstra et al41 and Benz et al.44 BFU-E, burst-forming unit-erythroid; E, erythroid; G, granulocyte; GEMM, granulocyte, erythrocyte, monocyte, megakaryocyte; Mk, megakaryocyte; NK, natural killer; DC, dendritic cell; T, T-lymphoid; B, B-lymphoid; STRC, short-term repopulating cell.

