. 2015 May 8;4:e06664. doi: 10.7554/eLife.06664

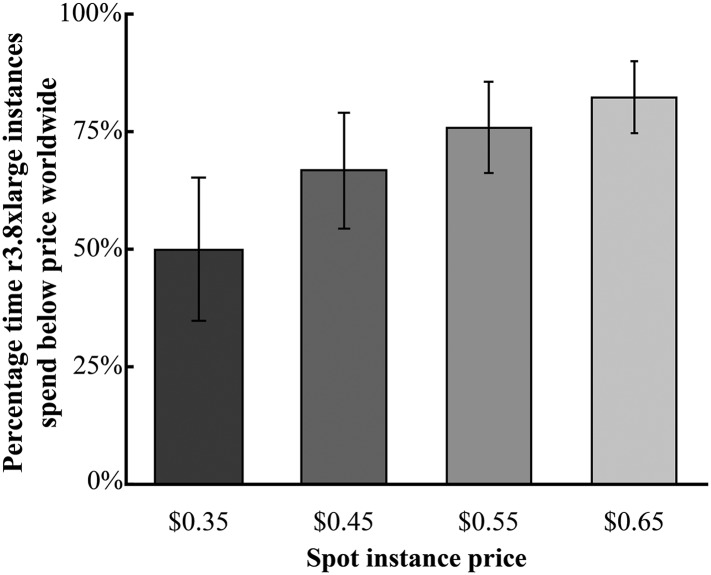
Figure 2. Global availability of Amazon r3.8xlarge spot instances.

Shown is the average percentage time spent by the r3.8xlarge type of instance when the current spot instance price was less than the queried price. The data are averaged over all Amazon's regions worldwide (except for SA-East-1, which does not offer r3.8xlarge instances). Spot instance prices were calculated over a 90-day period from 1 January 2015—1 April 2015, where the average is shown ± the s.e. Source data: Figure 2—source data 1.

DOI: http://dx.doi.org/10.7554/eLife.06664.004

Figure 2—source data 1. Global spot instance price data from 1 January 2015 to 1 April 2015.
elife06664s001.txt (14.3MB, txt)
DOI: 10.7554/eLife.06664.005

Figure 2.

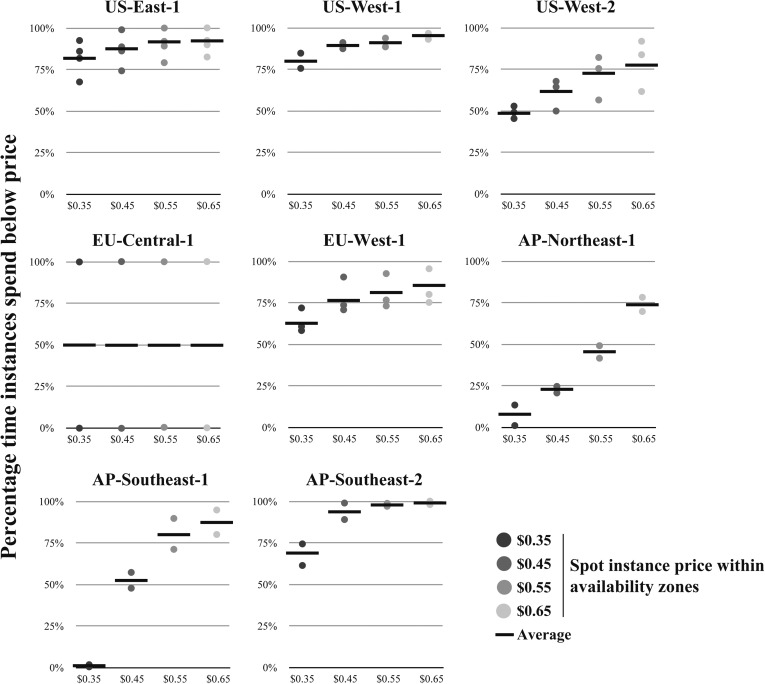
Figure 2—figure supplement 1. Availability of virtual machines within regions at specified spot instance prices.

Figure 2—figure supplement 1.

For each Amazon region (excluding SA-East-1, which does not offer r3.8xlarge instances), r3.8xlarge spot instance prices were retrieved for each availability zone, where separate availability zones are shown as separate data points for a given spot instance price. (Note: each region can have different number of availability zones). From the spot instance prices, the percentage time of the spot instances that were spent below the specified spot instance price were calculated. The average value is shown as a solid black line. Source data: Figure 2—source data 1.