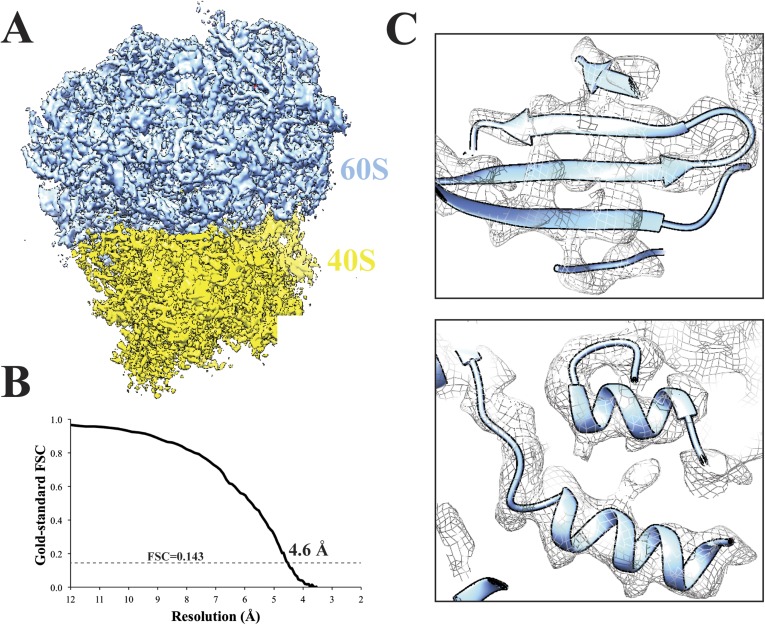
Figure 3. Cryo-EM structure of 80S ribosome at an overall resolution of 4.6 Å.
(A) Overall view of 80S reconstruction filtered to 4.6 Å while applying a negative B-factor of −116 Å2. (B) Gold standard FSC curve. (C) Selected regions from the 60S subunit. Cryo-EM maps were visualized with UCSF Chimera (Pettersen et al., 2004). Source data: Dryad Digital Repository dataset (http://datadryad.org/review?doi=doi:10.5061/dryad.9mb54) (Cianfrocco and Leschziner).

