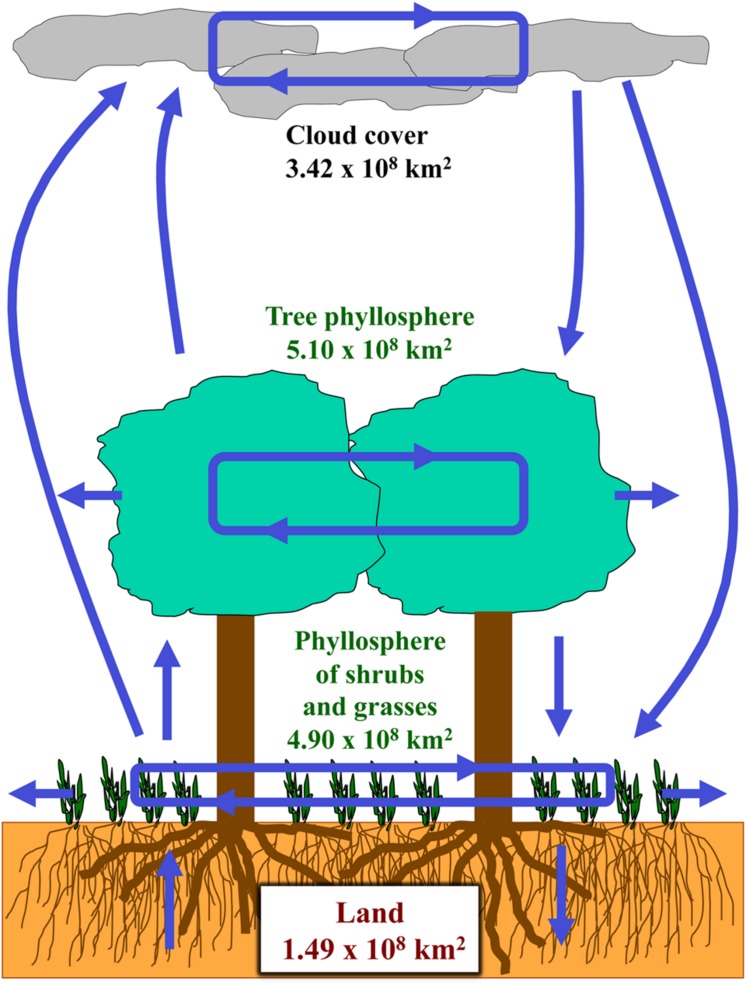
FIGURE 5.
Dynamics of interactions of plant canopies and the atmosphere. Land, plant strata, and cloud strata are represented, with estimates of global earth-wide surfaces, which were derived from recent studies (Friend, 2010; Probst et al., 2012; Vorholt, 2012). Interactions involving fluxes of microbial populations are symbolized by blue arrows (Lindemann et al., 1982; Finkel et al., 2012; Rastogi et al., 2012; DeLeon-Rodriguez et al., 2013; Šantl-Temkiv et al., 2013; Vaïtilingom et al., 2013; Hill et al., 2014).

