Fig. 5.
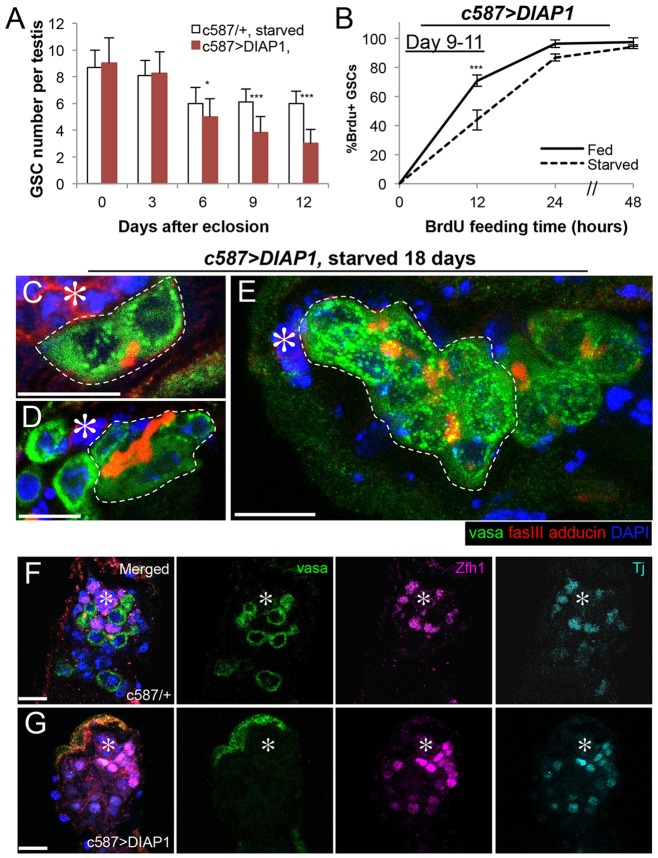
GSC maintenance is impaired during protein starvation upon blockade of CC apoptosis. (A) Average GSC number per testis over 12 days of starvation in DIAP1-expressing testes (c587>DIAP1). Data are mean±s.d. n>30 testes per data point. *P<0.05; ***P<0.0005 (Student's t-test). (B) BrdU incorporation kinetics in GSCs upon overexpression of DIAP1, demonstrating cell cycle slowdown upon starvation (contrary to wild type in which GSC cell cycle is unchanged between fed and starved conditions, Fig. 1D). Data are mean±s.d. n>100×3 GSCs per data point. (C-E) Representative images of interconnected two-cell (C), four-cell (D) and eight-cell (E) SG-like clusters attached to the hub at 18 days of starvation in DIAP1-overexpressing testis. (F) Representative images of a control testis that contains both germ cells and CySCs/CCs after 18 days of starvation. (G) Representative images of a DIAP1-expressing testis that contains CySC/CCs but is devoid of germ cells after 18 days of starvation. In C-G, the hub is indicated with asterisks. Scale bars: 10 µm.

