
Figure 1. Sox2+ Ptc MB Cells Are Quiescent.
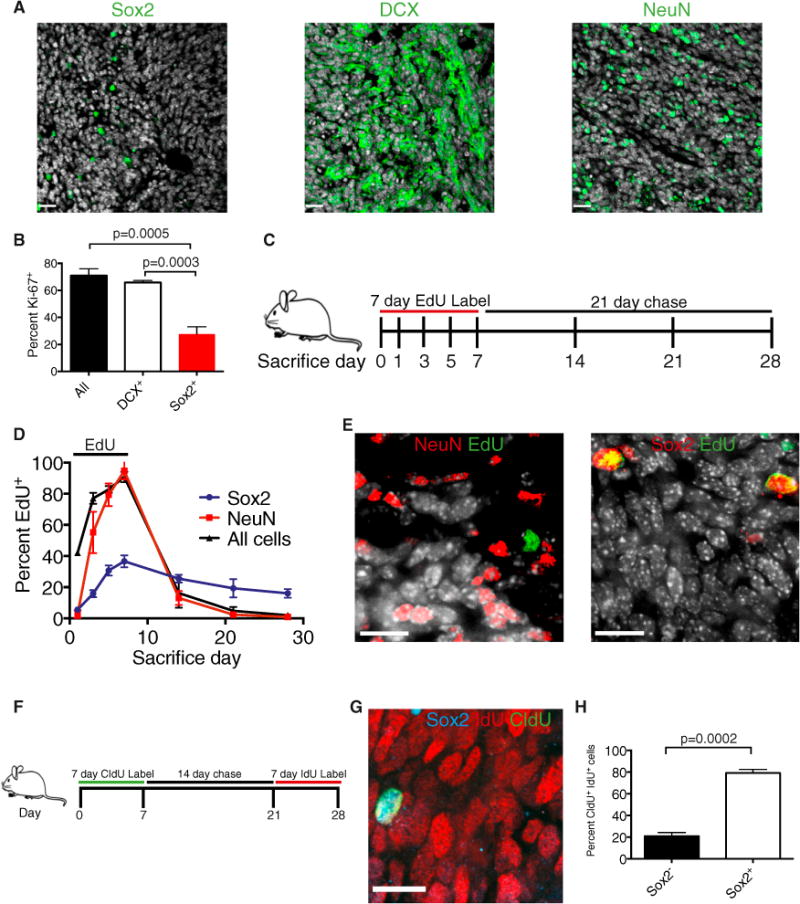
(A) Representative images of Ptc MB containing Sox2+ cells (<5%), DCX-expressing cells (60%), and NeuN-expressing cells (30%). DAPI is shown in white. Scale bars, 25 μm.
(B) Frequency of Ki67 expression in primary tumor cells: all counts, DCX+ cells, and Sox2+ cells (n = 3, mean ± SEM, two-tailed unpaired t test).
(C) Experimental design for (D) and (E). 31-day-old Ptc mice were administered 0.82 mg/mL EdU drinking water for 7 days (experimental days 0–7), followed by a 21-day chase. Mice were sacrificed on the indicated days of label or chase.
(D) The frequency of all EdU+ cells as well as NeuN+ and Sox2+ cells that are also EdU+ was quantified from primary tumor sections throughout the labeling and chase (n = 3 per group, mean ± SEM).
(E) Representative immunofluorescence images at the end of the chase (day 28). DAPI is shown in white. Scale bars, 14 μm.
(F) Experimental design for (G) and (H). 31-day-old Ptc mice were administered (0.74 mg/ml) CldU drinking water for 7 days, returned to normal drinking water for 2 weeks, and were then administered (1 mg/ml) IdU drinking water for 7 days. Mice were sacrificed at the end of the IdU labeling (day 28).
(G) A representative immunofluorescence image of a Sox2+ cell that retained the CldU label and acquired IdU. Scale bar, 14 μm.
(H) The frequency of Sox2-expressing cells within the CldU+ IdU+ population at day 28 (n = 3 per group, mean ± SEM, two-tailed unpaired t test). See also Figure S1.