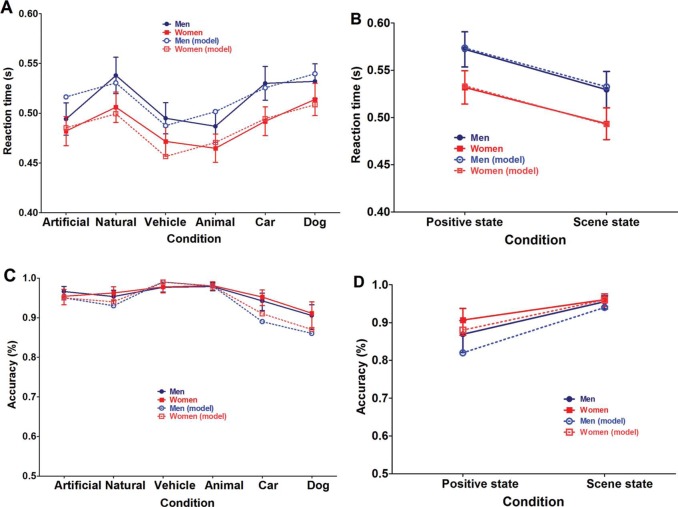
Figure 3.
Overview of reaction time (A) and accuracy (C) outcomes in the ultrarapid categorization animal/vehicle task. The data are represented as the mean performance across participants, with error bars depicting the standard error of the mean (SEM). For accuracy, mean and SEM were calculated based on the logistic transformation of the values and then retransformed into percentage correct (%) data. A similar overview is provided for the reaction time (B) and accuracy (D) outcomes in the ultrarapid categorization social task. Men are always depicted in blue, women in red. The dotted lines depict the mean expected RT (A, B) or accuracy (C, D) as fitted by the final model for both men (light blue) and women (light red) based on (1) a random intercepts regression analysis for RT and (2) a random intercepts logistic regression analysis for accuracy. The latter fit was averaged (for both RT and accuracy) over time.

