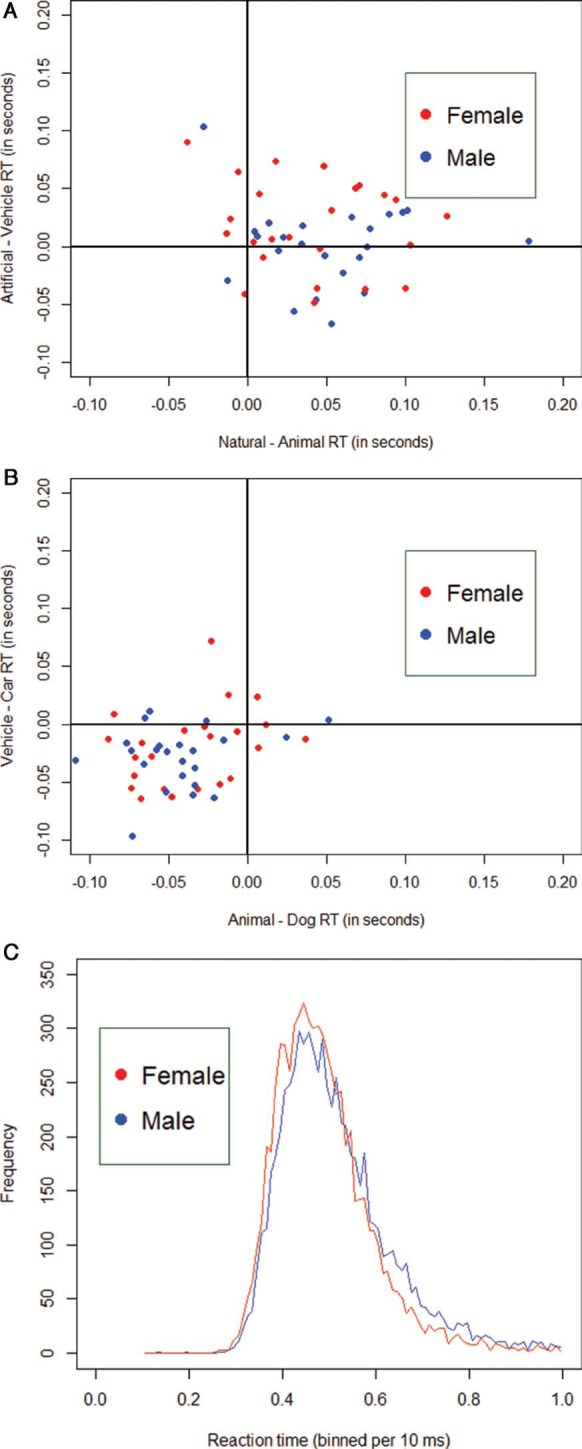
Figure 4.

Visualization of the data by means of scatterplots. In (A), we placed the individual subjects' median RT difference scores of the Artificial versus the Vehicle condition on the abscissa and the difference scores of the Natural versus the Animal RT scores on the ordinate axis. Men are always depicted in blue, women in red. For both axes, the largest part of the RT distribution lies above the origin (positive difference scores). This would indicate that people are generally faster at detecting an object (e.g., Vehicle or Animal) than detecting the scene gist (e.g., Artificial or Natural) in ultrarapid categorization. In (B), we placed the individual subjects' median RT difference scores of the Vehicle versus the Car condition on the abscissa and the difference scores of the Animal versus the Dog RT scores on the ordinate axis. For both axes, the largest part of the RT distribution lies below the origin (negative difference scores). This would indicate that people are generally faster at detecting a superordinate object (e.g., Vehicle or Animal) than detecting a basic-level object (e.g., Car or Dog). Furthermore, both scatterplots indicate differences in the specific RT distribution for men or women. The latter finding is also exemplified in (C), in which all RT data in the Animal/Vehicle task are binned per 10 ms and plotted with respect to frequency. The female RT distribution (red) peeks slightly earlier than the male RT distribution (blue) and has a lighter right tale.
