Figure 5.

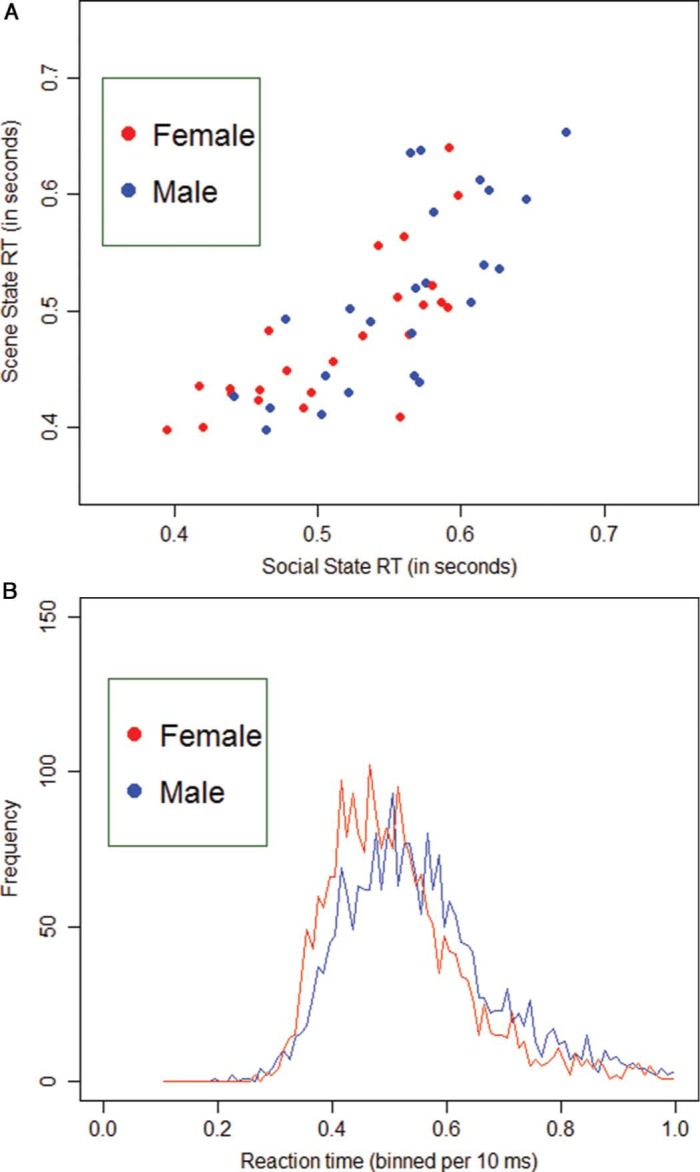
Visualization of the data by means of a scatterplot in (A). The individual subjects' median RT scores in the Social State (Is there a positive interaction (friendship) present in the scene?) are placed on the abscissa and those of the Scene State (Is the scene happening indoor?) on the ordinate axis. Men are always depicted in blue, women in red. Two things are noticeable from this graphical depiction: (1) people are generally faster at categorization of the Scene State in comparison with the Social State and (2) men seem to have larger RTs (on both tasks) in comparison to women. Similar conclusions can be drawn from (B), in which all RT data in the Social task are binned per 10 ms and plotted with respect to frequency. The female RT distribution (red) peaks clearly earlier than the male RT distribution (blue) and has a slightly lighter right tail.
