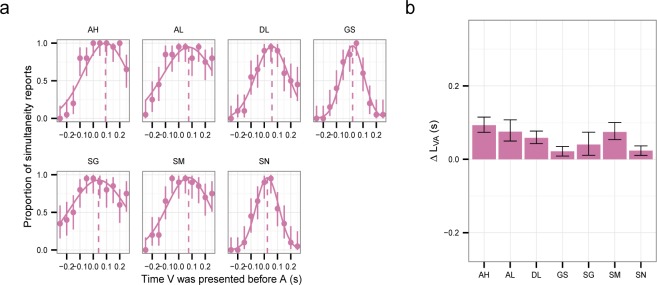
Figure 2.

Simultaneity judgments (SJ). (a) Proportion of simultaneity reports. The error bars are the 95% confidence intervals calculated using the Clopper–Pearson method. The three-parameter (amplitude, mean and standard deviation) normal distributions were fitted using maximum likelihood estimation. (b) ΔLVA estimated as the mean of the fitted distribution in (a). Positive values indicates longer latency for V. The error bars are the 95% bootstrap parametric confidence intervals.
