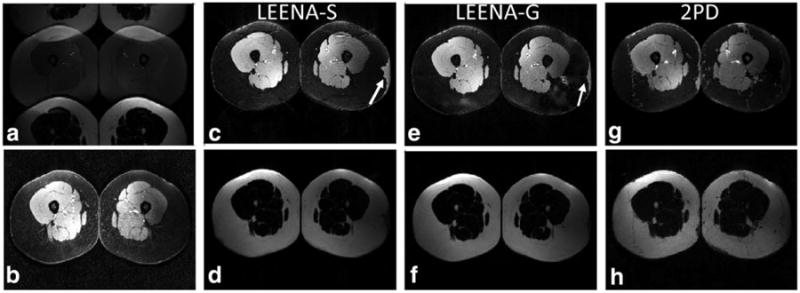
Fig. 4.

Axial leg images from a volunteer acquired on a 3.0T scanner. a: Raw LEENA image with N/2-ghost of the adipose tissue. b: Conventional fat-suppressed image using spectral excitation. c, d: Unghosted and off-resonance corrected LEENA-S water and fat images. e, f: Unghosted and off-resonance corrected LEENA-G water and fat images. g, h: Off-resonance corrected 2PD images as a reference. Arrows indicate regions of erroneous water-fat assignment due to increased field inhomogeneities near the edges of the FOV.
