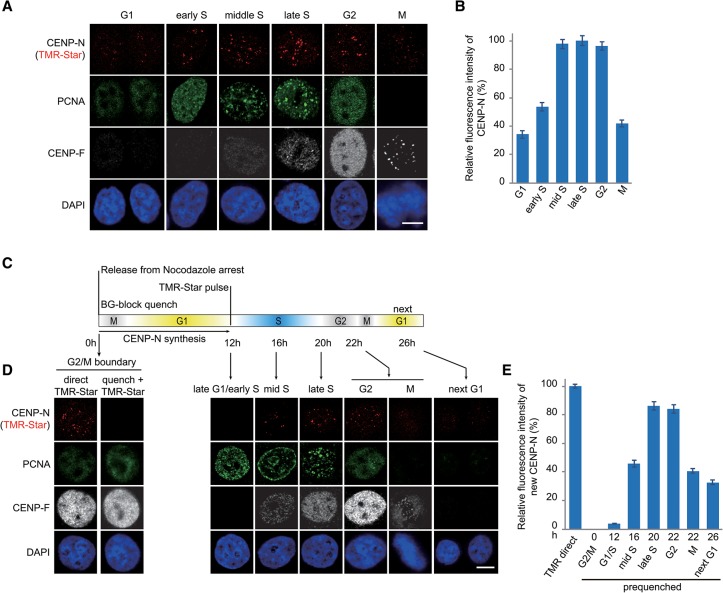
Figure 4.
Specific loading of CENP-N in middle/late S phase (see also Supplemental Fig. S6). (A) Representative images of HeLa cells expressing SNAP-CENP-N in different cell cycle phases. SNAP-CENP-N was labeled with TMR-Star (red), and cell cycle phases were determined by combined staining with CENP-F antibody (gray), PCNA antibody (green), and DAPI (blue). Bar, 10 µm. (B) Statistical analysis of the relative fluorescence intensity of SNAP-CENP-N during the cell cycle as shown in A. (C) Outline of cell synchronization and the labeling regimen for CENP-N loading. (D) HeLa cells expressing SNAP-CENP-N (red) were synchronized and labeled as depicted in C, and cell cycle phases were determined by combined staining with CENP-F antibody (gray), PCNA antibody (green), and DAPI (blue). Bar, 10 µm. (E) Statistical analysis of relative fluorescence intensity of SNAP-CENP-N newly synthesized and deposited onto centromeres as shown in D.

