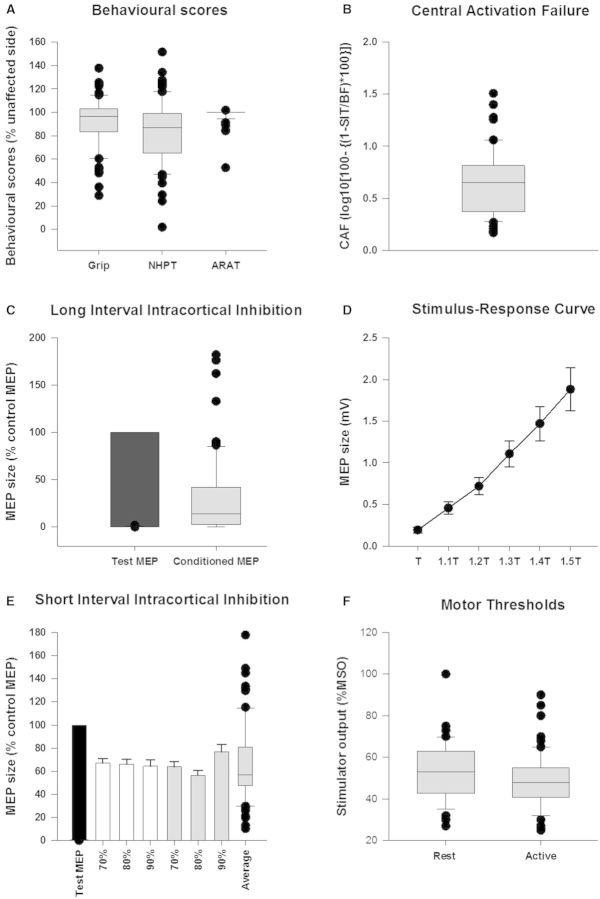
Figure 3.
Behavioural scores. (A) The behavioural scores of the affected upper limb as a percentage of the unaffected side, motor thresholds (F) and CAF (B) in 70 subjects. (C) The black bar represents the test response as a percentage of itself and the box plot is the mean conditioned motor evoked potential (MEP) response sizes in the long interval ICI protocol. In (D) average raw motor evoked potential sizes at various percentages of threshold (x-axis values, T to 1.5 T) are represented by the filled circles. The error bars represent standard errors. In (E), the black bar represents the test response as a percentage of itself, the white bars show responses where interstimulus interval was 2 ms, grey where interstimulus interval was 3 ms and the intensities on the x-axis are the intensities of conditioning pulses. The error bars represent standard error. The box plot in (E) shows the average short interval ICI across all six conditions. In C and E all conditioned responses were significantly smaller than test response (black bar), P < 0.05. The box plots (all grey boxes with horizontal line inside them) show the distribution of the data points with the horizontal line representing the median of the data and the black dots representing the outliers. NHPT = Nine Hole Peg Test; ARAT = Action Research Arm Test; SIT = superimposed twitch; BF = background force; MSO = maximal stimulator output.

