
Figure 5.
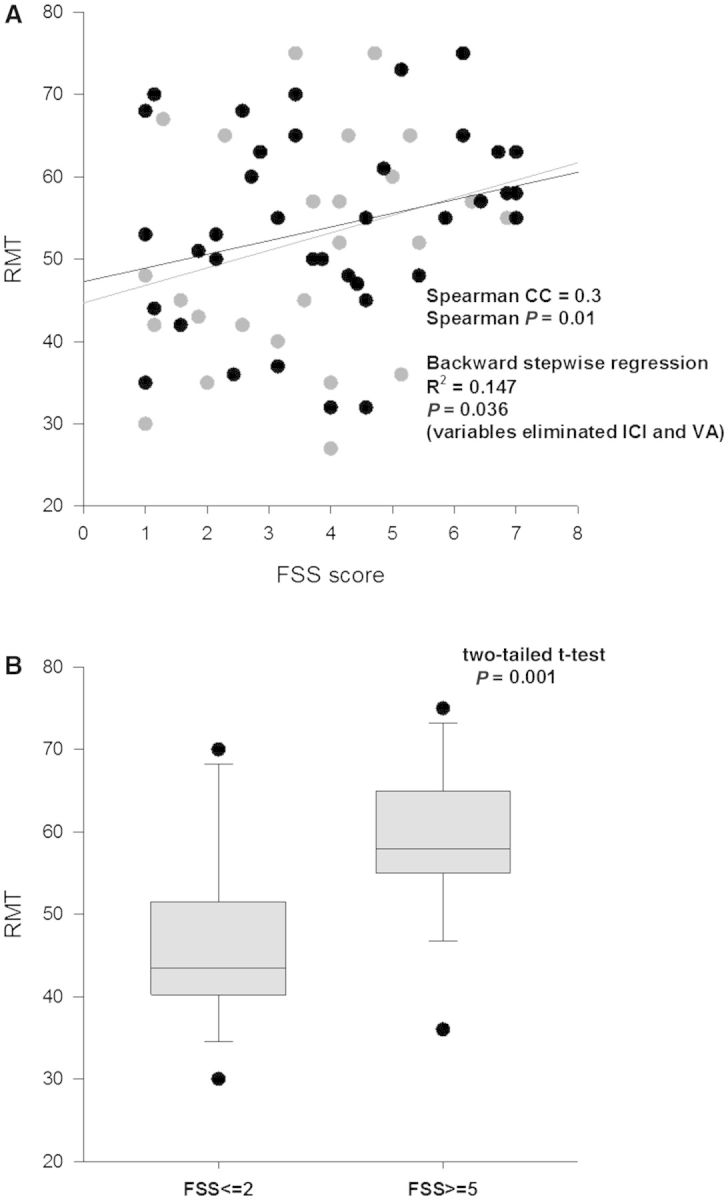
Corticospinal tract excitability and FSS score. RMT was correlated with FSS. In (A) the grey circles represent resting threshold of all participants (n = 70). In 40 of 70 participants, a true resting state was achieved during threshold measurement (black circles), the remaining 30 patients were unable to relax completely and there may have been a slight underestimation of resting threshold. In (B) the difference between resting thresholds in those with no fatigue (FSS score <2, n = 18) and those with extreme fatigue (FSS score >5, n = 18) is shown.