
Figure 7.
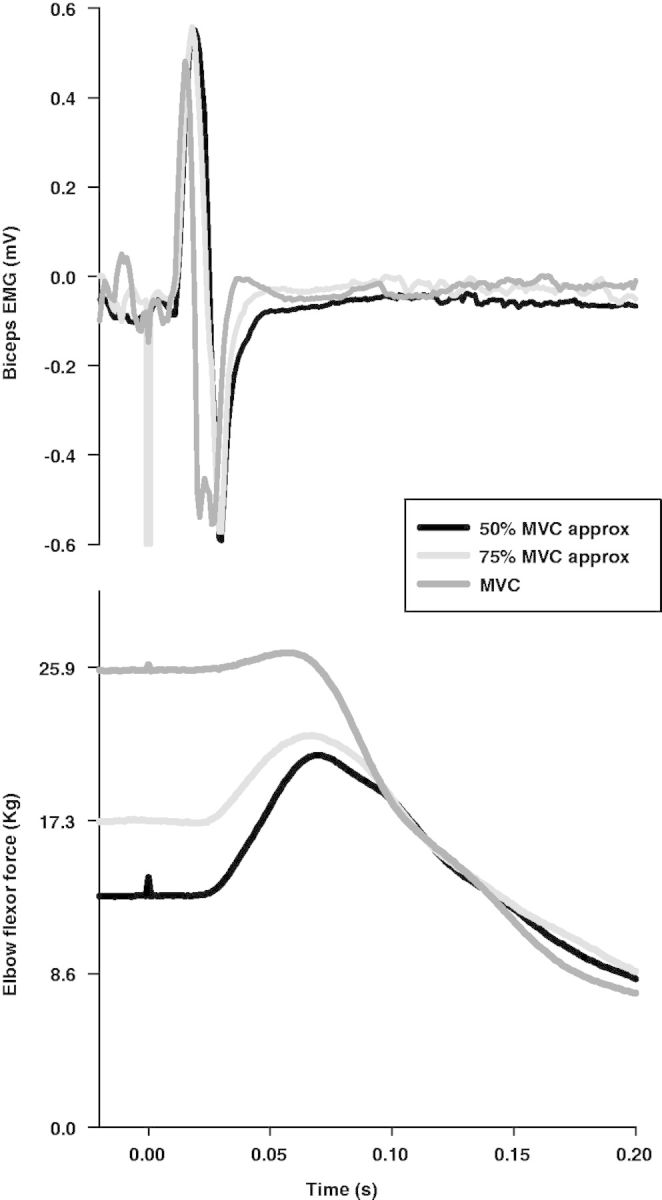
Example traces from the Central Activation Failure test. Single motor evoked potential (top) and twitch (bottom) responses from an individual subject show a decrease in the size of twitch with increasing voluntary force while the motor evoked potential sizes remain the same.