Figure 2.
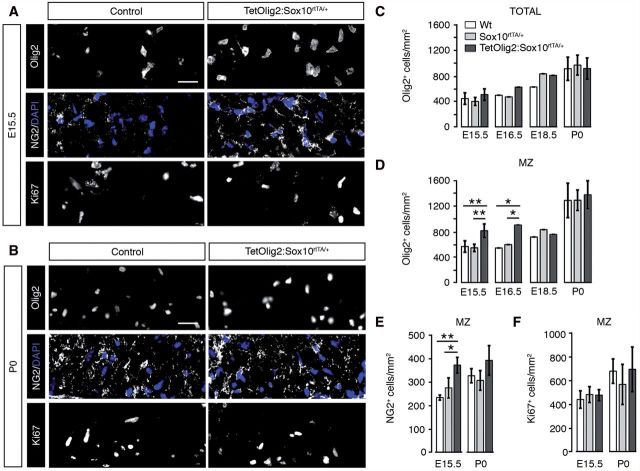
Targeted Olig2 overexpression leads to a transient increase of OPCs in the marginal zone. (A and B) Immunohistochemistry for Olig2, NG2 and Ki67 (grey) on spinal cord sections of control (wild-type and Sox10rtTA/+) and TetOlig2:Sox10rtTA/+ embryos at E15.5 (A) and P0 (B). A and B show areas of the marginal zone (MZ). NG2 labelling is shown in combination with DAPI to visualize cells by their nuclei. (C–F) Quantifications of Olig2+ oligodendroglial cells, NG2+ OPCs and Ki67+ cells in the whole spinal cord and in the marginal zone (n ≥ 3 for each genotype). (C) At all time points, the overall density of Olig2+ cells in the spinal cord was not affected in the analysed genotypes. (D) At E15.5 and E16.5, the density of Olig2+ cells was significantly increased in marginal zone of the TetOlig2:Sox10rtTA/+ mice (dark grey bars) with respect to wild-type (white bars, PE15.5 = 0.006, PE16.5 = 0.0084) and Sox10rtTA/+ mice (light grey bars, PE15.5 = 0.007, PE16.5 = 0.0084). (E) The density of NG2+ OPCs was also increased at E15.5 in the marginal zone of TetOlig2:Sox10rtTA/+ compared to wild-type (P = 0.008) and Sox10rtTA/+ (P = 0.031). Differences in Olig2+ or NG2+ OPC density were no longer observed at E18.5 and P0 (D and E). (F) The density of Ki67+ proliferative cells was similar in all genetic strains at E15.5 and P0. Scale bars = 20 µm. Wt = wild-type.

