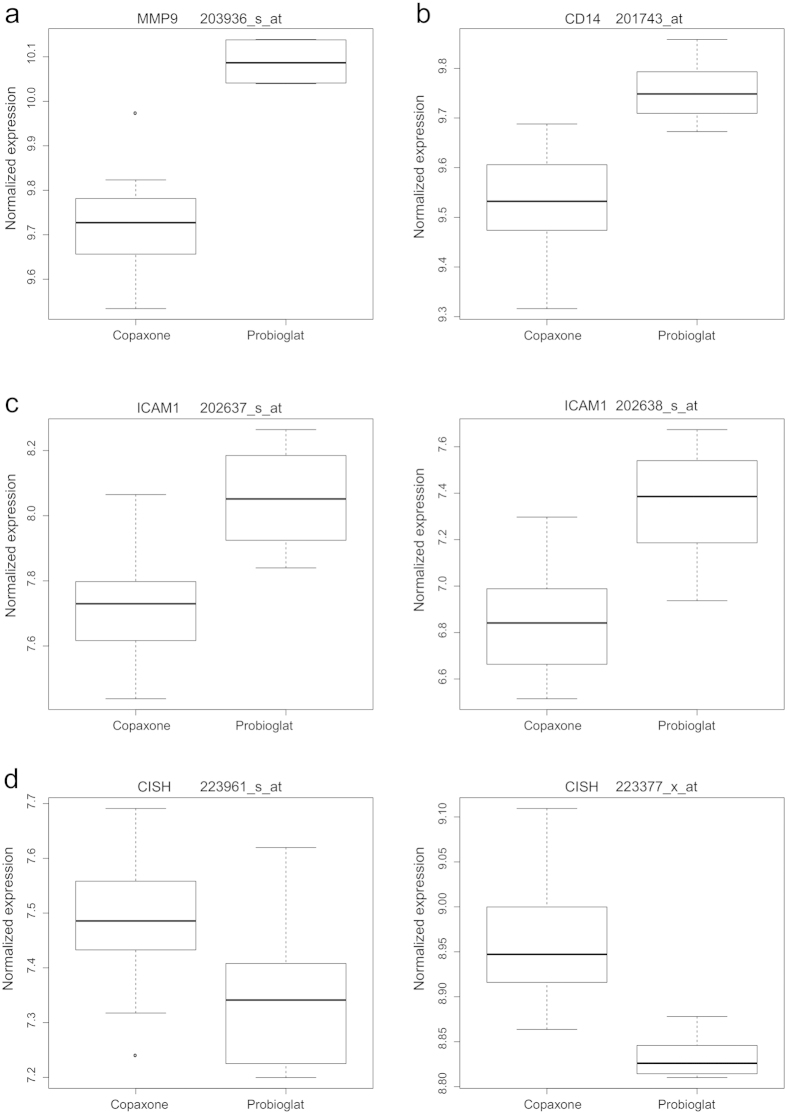
Figure 4.
Expression levels of genes differing between Probioglat and GA (a) MMP9 is significantly upregulated following stimulation by Probioglat compared to GA at 6 and 24 hours (FDR-adjusted p values for the single MMP9 probeset on the chip, 203936_s_at, are 2.74e-6, 0.098, and 0.004 for the 6, 12, and 24 hour timepoints, respectively). (b) CD14 expression is significantly higher with stimulation by Probioglat compared to GA at 6 hours (the single CD14 probeset on the chip is shown, 201743_at).(c) Both present ICAM1 probesets are significantly upregulated following stimulation by Probioglat compared to GA at 6 hours (A: probeset 202637_s_at; B: probeset 202638_s_at). (d) CISH is downregulated following stimulation by Probioglat compared to GA at 6 hours (both present probesets are shown, A: probeset 223961_s_at; B: probeset 223377_x_at).

