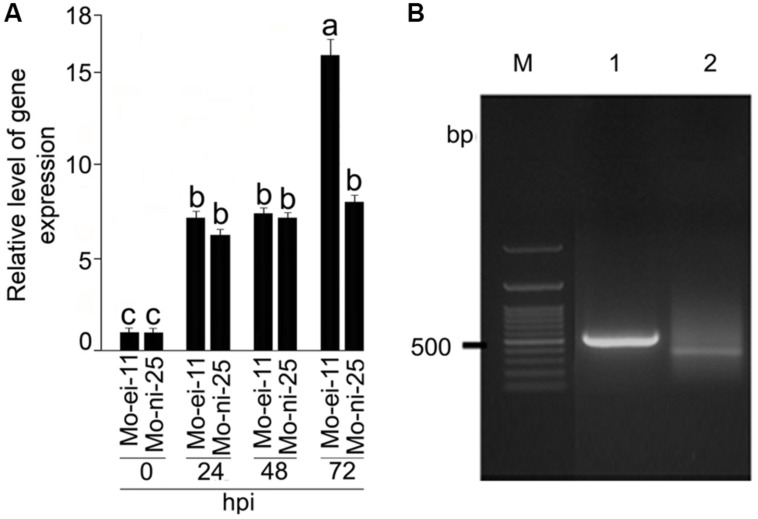
FIGURE 1.
Expression analysis CYP76M7 transcripts and mapping of its Transcription Start Site (TSS). (A) qRT-PCR analysis was performed to analyze the expression of CYP76M7 in response to infection by Magnaporthe oryzae isolate Mo-ei-11 and Mo-ni-25 at 24, 48, and 72 hpi. Values represent mean ± SE. Means with significant deference from each other (α = 0.05) is represented with different superscripts according to Tukey’s test. (B) 5′ RACE (Rapid Amplification of cDNA End) PCR; M: 100 bp GeneRuler (Fermentas) 1: Positive control (provided with the kit), 2: CYP76M7.

