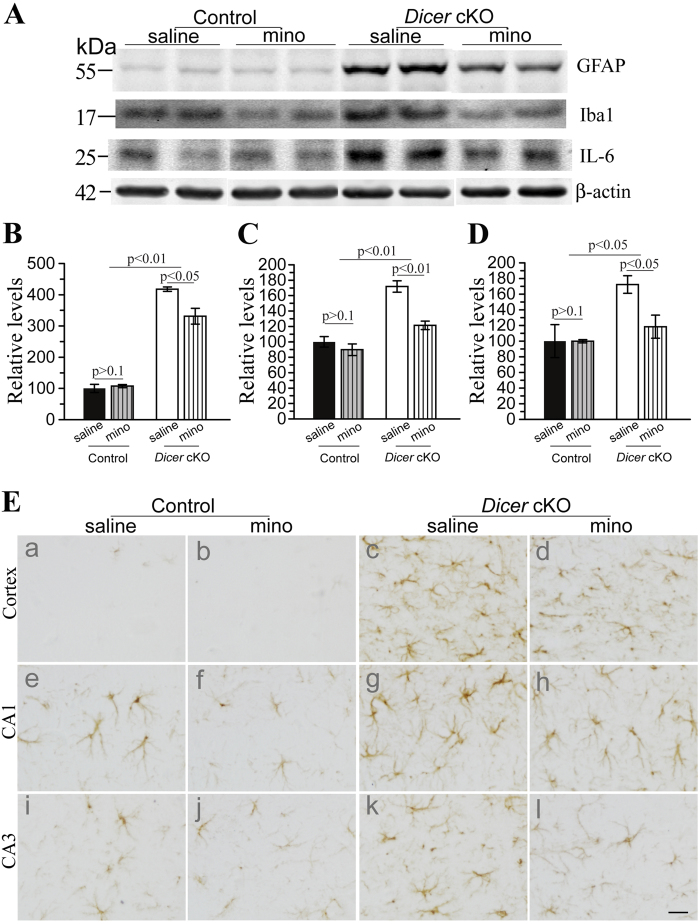
Figure 2. Minocycline reduced inflammatory responses in Dicer cKO mice.
(A) Western blotting for GFAP, Iba1 and IL6. β–actin served as the internal control. Representative WB bands for 4 groups of mice were shown. (B) Quantitative results for GFAP. There was significant difference in GFAP levels between control and Dicer cKO mice. GFAP levels in minocyline-treated cKOs significantly differed from those in saline-treated cKOs. GFAP levels in minocyline-treated control did not differ from those in saline-treated control. (C) Quantitative results for Iba1. Levels of Iba1 in minocyline-treated cKOs were significantly reduced as compared to saline-treated cKOs. The two control groups did not differ (p > 0.1). (D) Quantitative results for IL6. Levels of IL6 in minocyline-treated cKOs were significantly lower than those in saline-treated cKOs, and were not different from those in control mice. (E) Immunohistochemistry for GFAP. Abundant GFAP+cells were observed in the Dicer cKO mice. Minocyline-treated cKOs (d,h,l) showed less number of GFAP+cells than saline-treated cKOs (c,g,k) did. There was no difference in the number of GFAP+cells between minocyline- (b,f,j) and saline-treated control (a,e,i) mice. Scale bar = 20μm. Raw Western blotting images for GFAP, Iba1 and IL6 were shown in Supplementary Figures 2-3.

