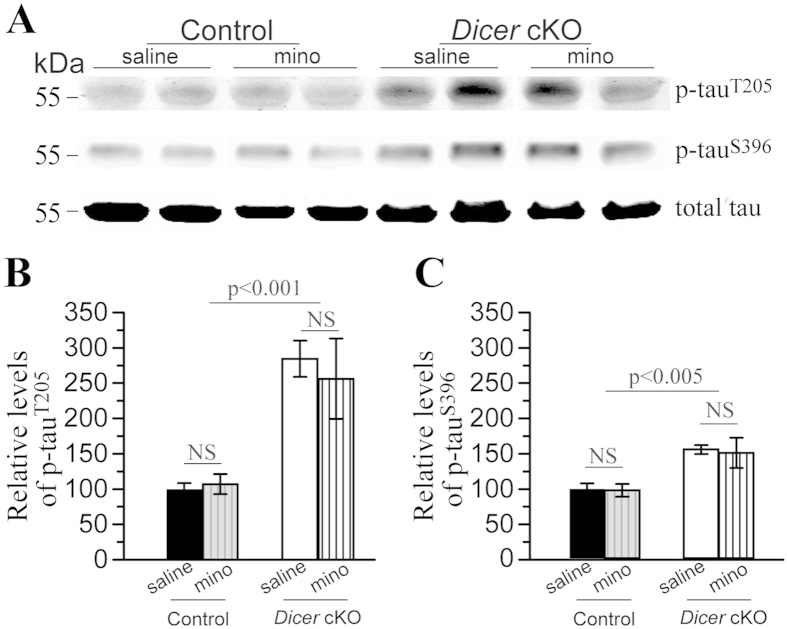
Figure 6. Minocycline did not reduce tau hyperphosphorylation in Dicer cKO mice.
(A) Western blotting for p-tau. Representative bands for p-tauT205, p-tauS396 and total tau were shown. (B) Quantitative results for p-tauT205. Relative levels of p-tauT205 to total tau were plotted for four groups of mice. There was significant increase in p-tauT205 levels in Dicer cKO mice, as compared to control animals. There was no difference between minocyline- and saline-treated Dicer cKO mice. (C)Quantitative results for p-tauS396. Relative levels of p-tauS396 to total tau were plotted and were increased in Dicer cKO mice. No difference in relative p-tauS396 levels was found between minocyline- and saline-treated Dicer cKO mice. Tau5 antibody was used to detect levels of total tau. There was no difference between Dicer cKO and control mice. Raw Western blotting images for p-tau and total tau were shown in Supplementary Figure 7.

