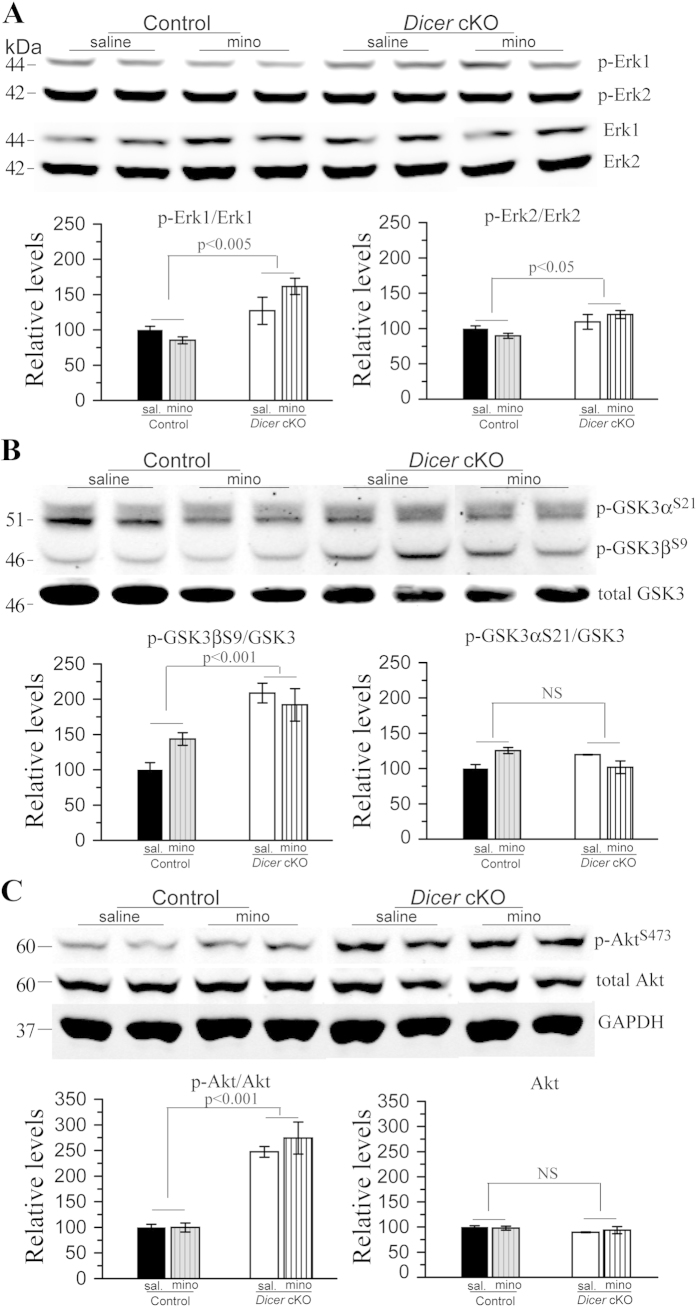
Figure 7. Minocycline did not affect activities of tau upstream kinases in Dicer cKO mice.
(A) Western blotting for Erk1/2. Representative bands for p-Erk1/2 and total Erk1/2 were shown. For quantification analysis on Erk1, Relative levels of p-Erk1 to total Erk1 were significantly increased in Dicer cKO mice, as compared to control animals. But there was no difference between minocyline- and saline-treated Dicer cKO mice. For quantification analysis on Erk2, relative levels of p-Erk2 to total Erk2 were increased in Dicer cKO mice (p < 0.05). There was no difference between minocyline- and saline-treated Dicer cKO mice. (B) Western blotting for GSK3α and GSK3β. Representative bands for p-GSK3βS9/p-GSK3αS21 and total GSK3 were shown. For quantification analysis on GSK3βS9, relative levels of p-GSK3βS9 to total GSK3 were significantly increased in Dicer cKO mice, as compared to control animals. For quantification analysis on GSK3αS21, relative levels of p-GSK3αS21 to total GSK3 were not changed in Dicer cKO mice. (C)Western blotting for p-Akt and total Akt. Representative bands for p-AktS473 and total Akt were shown. For quantification analysis, relative levels of p-AktS473 to total Akt were significantly increased in Dicer cKO mice, as compared to control animals. There was no difference between minocyline- and saline-treated Dicer cKO mice. Raw Western blotting images for phosphorylated Erk1/2, GSK3α, GSK3β and Akt were shown in Supplementary Figures 8–10.

