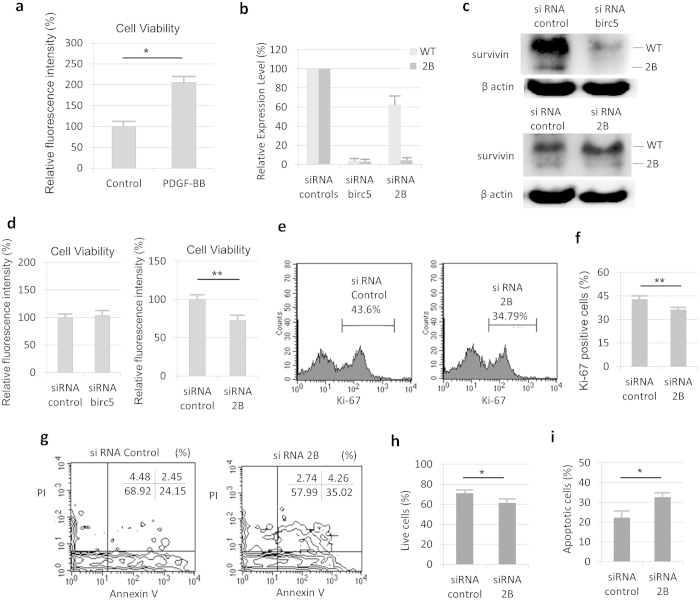
Figure 4.
Functional analyses using siRNA against survivin-2B in PDGF treated RA-FLS. (a) The calcein assay for cell proliferation was performed. PDGF increased the number of RA-FLS at 36hours (n = 4, p < 0.05). (b–i) RA-FLS treated with PDGF (10 ng/ml) and transfected with siRNA. (b,c) The siRNA birc5 (all survivin isoform silencer) decreased the expression levels of both survivin-WT and -2B. The siRNA 2B decreased the expression level of survivin-2B and had little influence on the survivin-WT expression. (b) The results of real-time PCR for siRNA-induced survivin silencing (n = 3). (c) The results of Western blot analyses for siRNA-induced survivin silencing with siRNA birc5 (upper) or siRNA 2B (lower). The cropped blots were used in the figure. (d) The viability of RA-FLS transfected with siRNA birc5 (left, n = 5) or siRNA 2B (right, n = 6) at 48 hours as determined using the calcein assay. (e,f) Measurement of Ki-67-positive RA-FLS transfected with siRNA at 48hours (n = 3). The positive rate was calculated as the number of Ki-67-positive cells among the total RA-FLS. (e) FACS plots for siRNA control (left) and siRNA 2B (right). (g–i) The annexin V and PI analysis for RA-FLS transfected with siRNA at 48hours (n = 4). H2O2 stimulation (0.1 mM) was performed for 3 hours before the analysis. (g) FACS plots for siRNA control (left) and siRNA 2B (right). (h) The percentage of live cells was calculated as the number of annexin V- and PI-double negative cells among the total RA-FLS. (i) The percentage of apoptotic cells was calculated as the number of annexin V-positive and PI-negative cells among the total RA-FLS. The results are the Means ± SEM. t-test ∗p < 0.05, ∗∗ p < 0.01.

