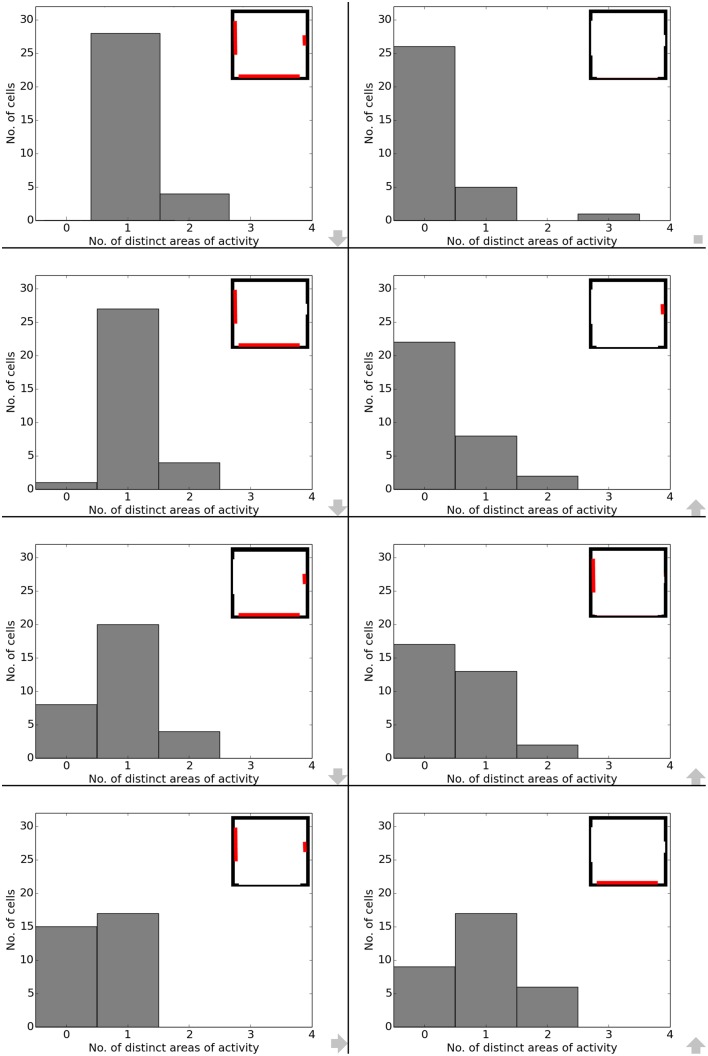
Figure 11.
Spatial consistency of the overall cell population during cue removal. Each plot depicts cell activity in a different version of the familiar environment holding all three cue cards. Inlets in the top right corner depict which cues (marked red) were still available during sampling of the environment. The order from smallest to largest change in the visual environment is indicated by grew arrows in the bottom right corner of each plot.

