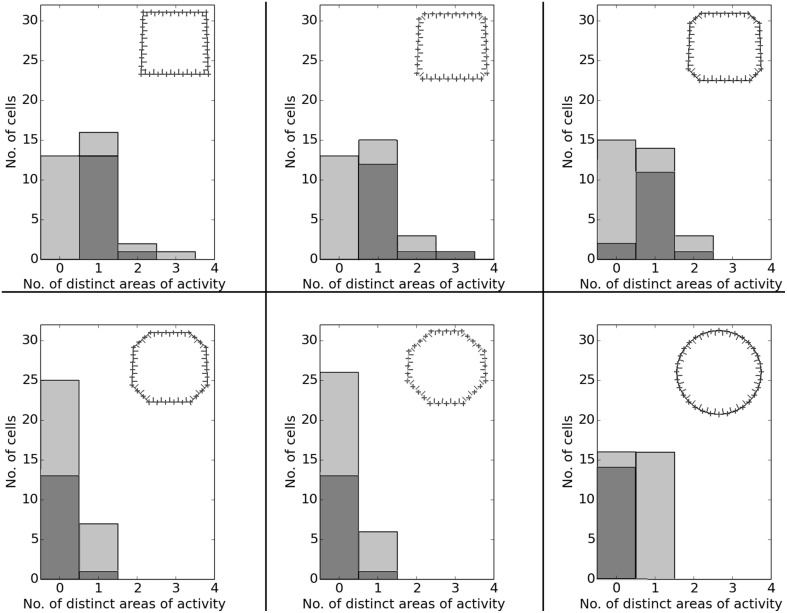
Figure 20.
Spatial consistency of the overall cell population in the different stages of the environment-morph experiment. Each plot depicts a different stage as indicated by the respective diagrams in the top right corner of each plot. Cells with preferred firing in the rectangular area are dark gray; cells with preferred firing in the circular arena are light gray.

