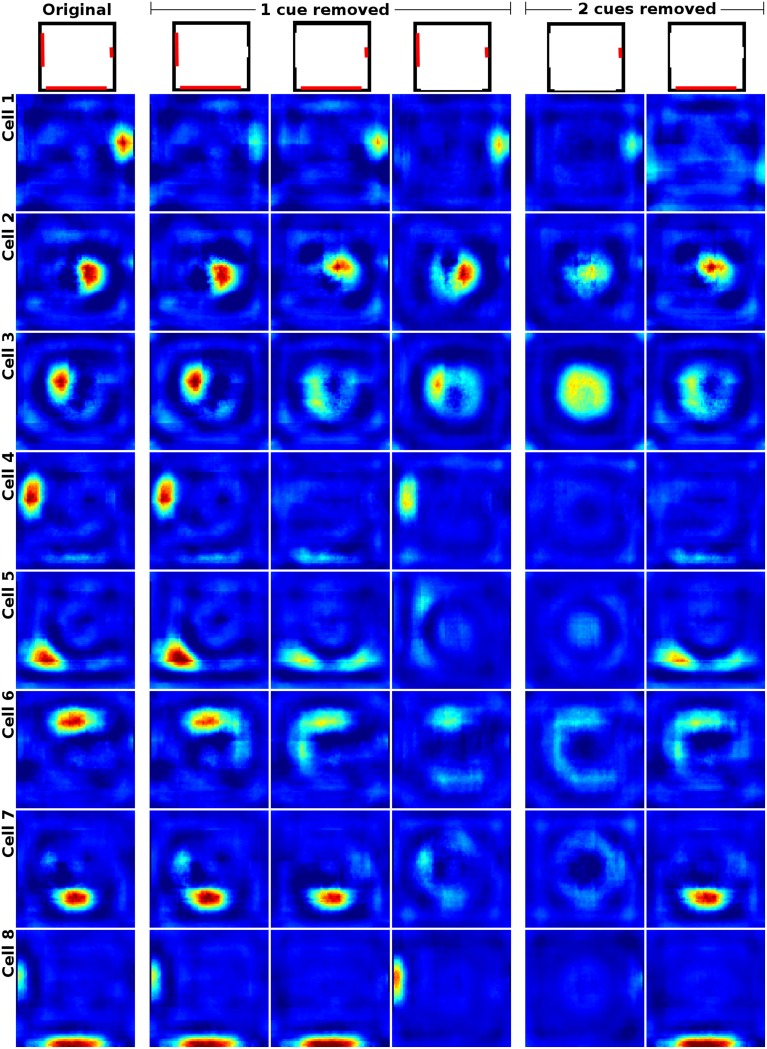
Figure 9.
Cell activity in a square environment with three removable cue cards (red) of different size. Each row shows the activity of a single cell during the removal of different subsets of the available cues (indicated at the top). Removing the smallest cue affects cell activity the least, with only place fields located close to the missing cue displaying a significant reduction in firing rate. Removal of the medium sized cue card leads to nearby firing fields displaying a distinctive loss in firing activity, while fields positioned further away are impacted considerably less. Removing the largest cue card has the largest overall effect on place field firing. All fields display an explicit reduction in firing activity with fields located near the cue being affected the most. Not all cells behave in the predicted way though and some try to compensate the loss of their associated cue by relocating to a position featuring a similar visual experience (see last row for an example). The rightmost two columns show cell activity with two cue cards removed. In this case most place fields not in direct contact with the single remaining cue card either vanish or develop multiple firing fields which usually are mirrored versions of the original field. This occurs especially in place fields that are located in geometrically distinct but visually indistinguishable locations, such as the corners or the center of the square arena (not shown here).

