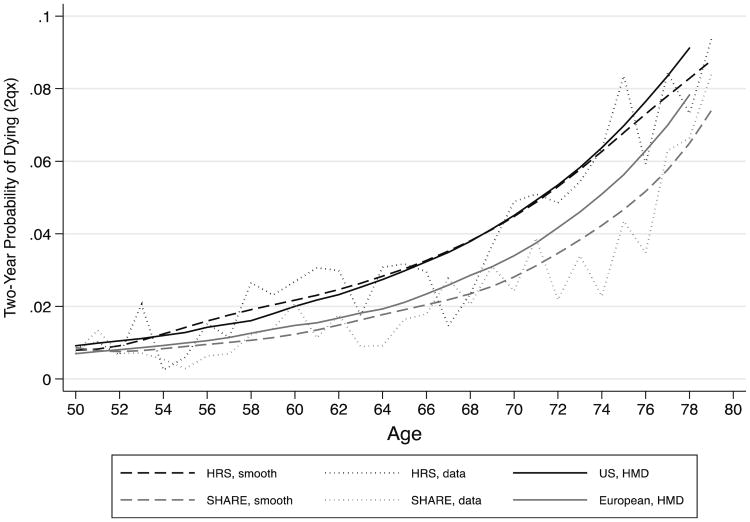
Fig. 1.
Comparison of survey probabilities of dying (2qx) and HMD life table probabilities of dying (2qx) 2004 for U.S. and five European countries. Curve of survey probabilities of dying are smoothed using a lowess filter and are weighted using sampling weights. SHARE includes Denmark, France, Italy, the Netherlands, and Spain

