Abstract
Implantation of cardioverter defibrillators is the most widely used primary preventive care for sudden cardiac death (SCD). Current clinical practice of using a left-ventricular ejection fraction threshold as the sole criterion for defibrillator insertion results in many unnecessary implantations. To address the need for alternative criteria, we seek three-dimensional shape metrics of the left ventricle derived from clinical cardiac magnetic resonance images that can predict SCD risk. The present study is a proof-of-concept, where we have combined image-processing and computational anatomy techniques to develop a processing pipeline to statistically compare localized left ventricular shape metrics between patient groups. We tested the methodology with data from a small cohort of patients, classified into two groups based on SCD risk. The results demonstrate that our approach is able to locate systematic wall thickness differences between the two groups.
I. Introduction
Despite significant advances in therapy, heart failure remains the leading cause of cardiovascular morbidity and mortality, and sudden cardiac death (SCD) accounts for about 50% of all deaths in heart failure patients, affecting hundreds of thousands of Americans per year [1]. Identification of patients who are at risk for SCD and providing them with implantable cardioverter defibrillators (ICDs) is the most widespread primary preventive method for SCD. Currently, the detection of SCD susceptibility is performed primarily based on the criterion of left ventricular ejection fraction (LVEF) < 35%. Though LVEF can be easily measured non-invasively using various imaging techniques, this parameter alone does not adequately characterize SCD risk. Indeed, amongst patients who are selected solely on the basis of LVEF, the rate of appropriate device firings averages only about 5% per year [2]. Furthermore, ICD therapy is costly, and can lead to procedural complications, infections, device malfunctions, increased risk for subsequent heart failure events, and diminished quality of life [3]. Hence, a more accurate approach to identifying patients who would benefit from ICD therapy is desired.
It is well-known that LV remodeling in cardiomyopathies, which often includes LV dilation, shape alterations, and wall thinning, is a strong predictor of morbidity and cardiovascular mortality [4]. However, little in the way of knowledge of the three-dimensional (3D) shape of the diseased heart is incorporated into current risk algorithms for SCD. Incorporating knowledge of the anatomic risk factors, using a safe, accurate and reproducible non-invasive imaging approach, may significantly enhance SCD risk prediction algorithms and better identify a phenotype at risk for SCD.
Among imaging modalities, cardiac magnetic resonance imaging (CMRI) and its combination with late gadolinium enhancement (LGE) have emerged as powerful methods to accurately and reproducibly describe myocardial tissue structure, and the remodeling of this structure under disease conditions [5]. Additionally, the recently developed field of computational anatomy offers rigorous mathematical and algorithmic tools for the description, transformation, comparison, and statistical inference regarding image-based cardiac geometry [6]. These advances have, however, not been leveraged for assessment of SCD risk in a sufficiently large, clinically-relevant population undergoing ICD implantation.
The overarching goal of our project is to develop and test a methodology to identify three-dimensional (3D) LV shape metrics that can predict SCD risk, based on CMRI data and computational anatomy techniques, to improve selection of patients for ICD implantation. The present study is a proof-of-concept, in which we have implemented an image-processing pipeline to compare 3D LV wall thickness and epicardial surface curvature between patient groups. We have tested our methodology with data from patients who were selected for ICD implantation based on reduced LVEF, followed after implantation for events such as appropriate ICD firing, and divided into two groups with differing SCD risks based on the follow up data. Our results demonstrate that the proposed methodology can locate regions of statistically significant LV wall thickness differences between the two groups.
II. Methods
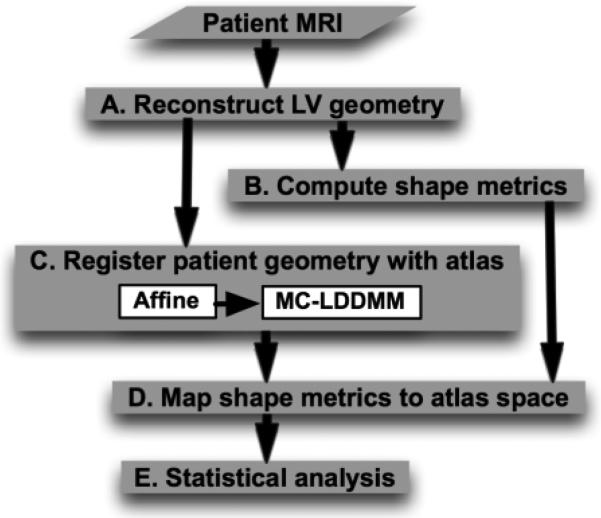
Fig. 1 outlines the processing pipeline for our methodology. Given a collection of patient images, the overall scheme is to reconstruct the LV geometries from the images, compute shape metrics from the reconstructed geometries, register the geometries with an arbitrarily chosen geometry referred to as the atlas, map shape metrics to the atlas space based on the registration, and perform statistical analysis on this mapped data. In the following, we describe the various components of the pipeline by demonstrating how a CMRI image of an example patient was processed. The letters A-E inside the blocks in Fig. 1 refer to the corresponding subsections below.
Fig. 1.
Processing pipeline for detecting 3D LV shape metrics that may predict SCD
A. Reconstruction of 3D LV Geometry
The reconstruction of LV geometry from clinical MR images is a very challenging task, because the intensity contrast between myocardial tissue and the rest of the torso is poor, and the image resolution is very low, especially orthogonal to the short-axis plane, where it averages about 10mm. We have adopted a semi-automatic approach for the LV reconstruction as illustrated in Fig. 2. Briefly, in each short-axis slice of the image, smooth contours that represent LV endocardium and epicardium were semi-automatically drawn using CineTool® (General Electric Healthcare). The section of the endocardial contour that belongs to the septum was then manually identified by placing two landmark points near the right-ventricular (RV) insertion points using a graphical user interface developed in-house in MATLAB® (Mathworks, Inc.). Fig. 2A shows the contours and landmark points for an example image slice. From the contours and landmark points, three sets of 2D binary masks, each set implicitly representing the LV endocardium, LV epicardium, and septal endocardium were constructed as displayed in Fig. 2B. To construct the mask for septal endocardium in each slice, two rays that start from the centroid of the endocardium and pass through the landmark points were computed, and the pixels that lied between the rays marked. Each set of 2D masks was then interpolated to build a 3D binary mask at 1mm isotropic resolution, based on a variational strategy proposed by Turk and O'Brien [7]. In this process, for each set of 2D masks, a 3D thin plate spline function f was defined such that f = 0 at pixels along the perimeters of the masks, and f = 1 at pixels those are adjacent to the perimeter pixels and inside the mask. By discretizing the 3D functions, and thresholding for values above 0, 3D masks for LV endocardium, LV epicardium, and septal endocardium were generated. We had experimented with alternative techniques for interpolation, including cubic splines [8], spherical harmonics [9], and cylindrical harmonics [9], but found that the variational strategy outperforms the others in terms of accuracy of fit and smoothness of interpolation. Finally, the geometry image of the LV wall was generated by combining the three 3D masks, as illustrated in Fig. 2C. Note that the final geometry image has three different intensities, one for each of the LV chamber, LV free-wall, and septal regions.
Fig. 2.

Reconstruction of 3D LV geometry from CMR image slices. (A) An example slice highlighted with endocardial (red) and epicardial (blue) contours, and the endocardial landmarks (green) corresponding to the septum. (B) The 2D LV endocardial (red, appearing as magenta), LV epicardial (blue), and septal endocardial (green) masks superimposed on each other. (C) The reconstructed 3D geometry after interpolation; the coloring scheme is similar to (B).
B. Computation of Shape Metrics
For each voxel along the epicardial surface of the reconstructed 3D geometry, the principal curvatures of the surface, and the thickness of the LV wall were computed. The curvature values were computed as described in Goldman [10]. Given a surface implicitly represented as an isosurface of a function g in 3D, the principal curvatures at each point on the surface are given by
where ∇g and H(g) denote the gradient and Hessian of g. We evaluated two options for g, namely the 3D thin plate spline function f, and a Gaussian-smoothed version the 3D mask, where both f and the mask were built as described above from the set of 2D binary masks corresponding to the epicardium. We adopted the latter option because it was found to be less susceptible to noise. The mean and Gaussian curvatures of the surface points were be obtained by computing the average and product of the principal curvatures, respectively [10]. The wall thickness at a voxel along the epicardial surface was calculated as the distance to the nearest voxel that lied along the endocardium. Fig. 3 shows the spatial distribution of the mean curvature and wall thickness corresponding to the LV geometry in Fig. 2C.
Fig. 3.
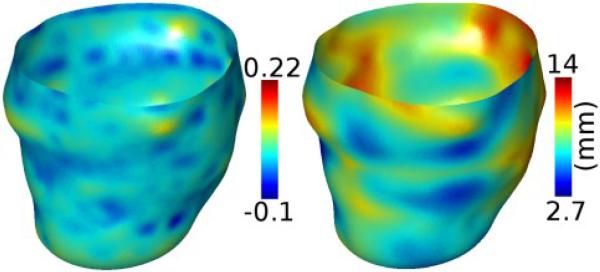
Shape metrics computed for the LV geometry shown in Fig. 2C, displayed on the epicardial surface. (A) Epicardial curvature. (B) Wall thickness.
C. Registration of Patient Geometry with Atlas
To perform statistical analysis of the localized shape metrics computed in the previous step, it was necessary to establish a common coordinate system for all patient geometries. To this end, we computed an anatomically meaningful bijective correspondence between each patient LV geometry and the geometry of an atlas using image registration algorithms, where the atlas is an LV geometry arbitrarily selected from the set of patient geometries. Fig. 4A displays the atlas geometry that we used in the present work. The bijective correspondence was computed using a combination of affine transformation and multi-channel large deformation diffeomorphic metric mapping (MC-LDDMM), with the 3D endocardial, epicardial, and septal masks described under Section 2A as channels [11]. The affine transformation was based on seven landmark points: the apex, the centroid of the LV chamber at the base, the two RV insertion points at the base, and three points that evenly divided the epicardial contour of the LV free-wall at the base. These landmarks points were automatically extracted from each LV geometry image. The affine transformation provided an initial registration for MC-LDDMM, a non-linear image registration algorithm that computes diffeomorphic (invertible and smooth) transformations between images [11]. Given an atlas image Ia:Ω → R and a patient image Ip:Ω → R, MC-LDDMM computes a flow of diffeomorphisms ϕt:Ω → Ω to transform Ia to match p, where Ω ⊂ R3 is the 3D cube in which the image data are defined, and t∈[0, 1]. The diffeomorphic property of MC-LDDMM guarantees that the atlas does no “fold over” itself during deforma ion, thereby preserving the integrity of anatomical structures. For detailed mathematical descriptions of the MC-LDDMM algorithm and implementation, the reader is referred to previous publications [6, 11]. Fig. 4B-D illustrate the registration of the atlas geometry with the patient geometry shown in Fig. 2C.
Fig. 4.
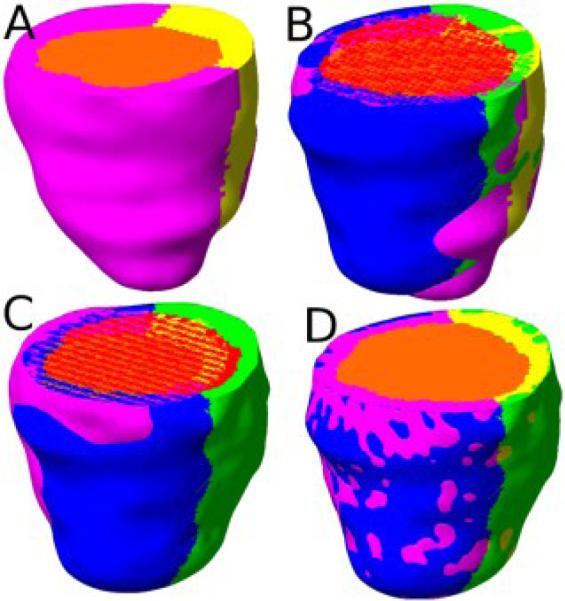
Registration of the atlas geometry to match the patient geometry shown in Fig. 2C. (A) The atlas geometry with LV chamber (orange), LV free-wall (magenta), and septum (yellow). (B) The superimposition of the patient geometry and the atlas geometry. (C) The patient geometry and atlas geometry after affine transformation. (D) The patient geometry and the atlas geometry after MC-LDDMM transformation.
D. Mapping of Shape Metrics to Atlas Space
Based on the bijective mappings computed in the previous step, the shape metrics calculated at each epicardial point of a given patient LV geometry was mapped onto the corresponding point of the atlas epicardium. Mathematically, if x is a point on the epicardial surface of a patient geometry, and φ the bijective mapping from the atlas to that patient LV geometry, then the shape metrics at xare mapped onto the epicardial point on the atlas that is nearest to φ-1(x). Note that, due to imperfections in volume registration, φ-1(x) was not guaranteed to be an epicardial point on the atlas, and therefore, the nearest neighbor calculation was required. Fig. 5 illustrates the mapping of wall thickness data in Fig. 3B onto the atlas epicardial surface. Evidently, the pattern in Fig. 5 is a deformed version of that in Fig. 3B.
Fig. 5.
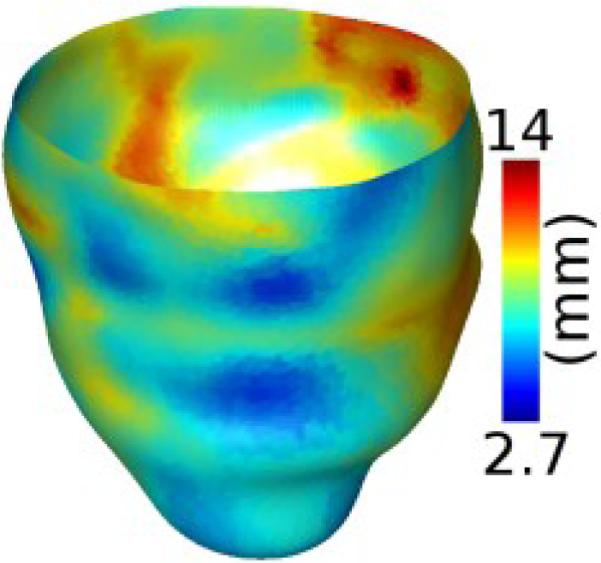
Wall thickness data in Fig. 3B displayed on the epicardium of the atlas geometry in Fig. 4A after the mapping illustrated in Fig. 4BD.
E. Statistical Analysis
Following the step described above, each point on the atlas epicardium was associated with curvature and thickness values from the corresponding point on the epicardium of each of the patient geometries. In the final step of the methodology, the collection of patients were divided into two or more groups based on post-imaging follow up data such as number of ICD firings. A Wilcoxon rank-sum test (for two groups) or a Kruskal-Wallis test (three or more groups) [12] was performed on each shape metric separately at each point on the atlas epicardium. A significance level of α = 0.05 was used to determine points with statistical differences. The analysis was performed with and without correction for multiple comparisons, where the correction was performed using permutation tests [13].
III. Results
Data used for the present study consisted of a breath-held, multi-slice single-shot 2D inversion-recovery true fast imaging with steady-state precesssion LGE-CMR images of 14 patients with ischemic cardiomyopathy randomly selected from the CMR arm of the Prospective Observational Study of implantable Cardioverter Defibrillators (CMR-PROSE-ICD) at Johns Hopkins University. The CMR-PROSE-ICD started enrolling patients receiving ICD therapy for primary prevention of SCD beginning in 2003 [14]. The advantage of single-shot images is that they are acquired in a single breath hold, thereby limiting breathing motion artifacts. The image acquisition was performed prior to ICD implantation, and the patients were followed for events after implantation, including appropriate ICD firings for ventricular arrhythmias, heart failure hospitalizations, and SCD. More details of the CMR-PROSE-ICD data can be found in previous publications [5, 14]. Of the 14 patients, 5 patients had no ICD firings during follow up and comprised the “low risk” group. In the remaining 9 patients, comprising the “high-risk” group, each had at least one appropriate ICD firing or died of SCD or was hospitalized for heart failure.
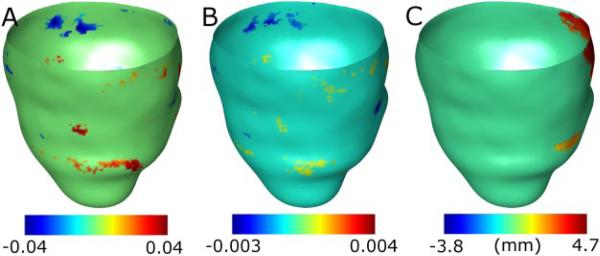
One of the patient hearts in the low-risk group was chosen as the atlas (see Fig. 4A), and mean curvature, Gaussian curvature, and wall thickness metrics were statistically compared between the two groups, as described in Section II. Fig. 6 shows the results of the analysis without correction for multiple comparisons, overlaid on the epicardial surface of the atlas. Each point on the surface with a statistically significant result is displayed with a non-zero value, where the value equals the mean of the shape metric at the point corresponding to the high-risk group subtracted from that corresponding to the low-risk group. The analysis with correction for multiple comparisons produced no significant regions for any of the shape metrics in this study.
Fig. 6.
Results of statistical analysis of the shape metrics, overlaid on the atlas epicardial surface. (A) Analysis of mean curvature. (B) Analysis of Gaussian curvature. (C) Analysis of wall thickness. The orientation of the surface is the same as that in Fig. 4A.
In Fig. 6, there are several regions on the surface with statistically significant differences in curvatures, but these regions are very small, and therefore likely spurious. As such, we observe no physiologically meaningful differences in curvature values between the two groups. Similarly, there are a few small regions with statistically significant differences in wall thickness. However, there is one large region at the base of the septum with significant thickness results, where the mean thickness of the high-risk group is smaller than that of the low-risk group. The mean thickness difference in this region was 3.4mm. Since changes in wall thickness result from myocardial infarction, which appears as high signal intensity regions by LGE-CMR, we examined the image data to check if the statistical results are physiologically meaningful. Our evaluation revealed that, in 9 out the 14 patients, there was intensity enhancement in the basal septal region of the image, indicating that significant differences in wall thicknesses were co-located with infarction. These results demonstrate that our methodology is able to locate systematic differences in LV wall thickness between groups of patients for SCD risk prediction.
IV. Conclusion
The goal of this study was to develop an image-based methodology for detecting differences in LV shape metrics between subject groups, for better selection of patients for ICD implantation, the primary preventive care for SCD. Our methodology was tested with a small population of patients that was divided into two groups, namely low-risk and high-risk, based on post-implantation follow up data. The results demonstrate that, through there are no systematic epicardial surface curvature differences between the two groups, there are infarct-related wall thickness differences. Accordingly, the proposed methodology is an important first step toward combining state-of-the-art computational anatomy techniques and 3D shape metrics to assess SCD risk. Moreover, all steps of our processing pipeline, except the semi-automatic contouring of short-axis data, are completely automated, and this will facilitate the analysis of large amounts of data.
The present study is a proof-of-concept for utilizing localized 3D LV shape metrics for SCD risk assessment, and accordingly, only a small population of patients was used. Extensive analysis of larger cohorts of patients will be necessary to identify specific shape differences between groups of patients with different risk levels. Also, the manual intervention in contouring may have introduced artifacts in curvature measurements. Finally, it will be important to extend our methodology to incorporate the shape, size, and location of the infarct, as infarct border regions have been associated with increased susceptibility to arrhythmias [5]. In so doing, patient-specific LV anatomy predisposing to SCD may be identifiable and potentially incorporated into clinical risk stratification models.
Footnotes
Research supported by National Institutes of Health grants R01HL103812 and R24HL085343.
Contributor Information
Fijoy Vadakkumpadan, Department of Biomedical Engineering, Johns Hopkins University, Baltimore, MD 21218 USA (phone: 443-912-3241; fax: 410-502-9814; fijoy@jhu.edu)..
Natalia Trayanova, Department of Biomedical Engineering, Johns Hopkins University, Baltimore, MD 21218 USA (ntrayanova@jhu.edu)..
Laurent Younes, Department of Applied Math and Statistics, Johns Hopkins University, Baltimore, MD 21218 USA (laurent.younes@jhu.edu)..
Katherine C. Wu, Department of Medicine, Johns Hopkins Medical Institutions, Baltimore, MD 21287 USA (kwu@jhmi.edu).
REFERENCES
- 1.Zipes D, Camm A, Borggrefe M, Buxton A, Chaitman B, Fromer M, Gregoratos G, Klein G, Moss A, Myerburg R. ACC/AHA/ESC 2006 Guidelines for Management of Patients With Ventricular Arrhythmias and the Prevention of Sudden Cardiac DeathA Report of the American College of Cardiology/American Heart Association Task Force and the European Society of Cardiology Committee for Practice Guidelines (Writing Committee to Develop Guidelines for Management of Patients With Ventricular Arrhythmias and the Prevention of Sudden Cardiac Death) Journal of the American College of Cardiology. 2006;48(5):e247–e346. doi: 10.1016/j.jacc.2006.07.010. [DOI] [PubMed] [Google Scholar]
- 2.Bardy GH, Lee KL, Mark DB, Poole JE, Packer DL, Boineau R, Domanski M, Troutman C, Anderson J, Johnson G, McNulty SE, Clapp-Channing N, Davidson-Ray LD, Fraulo ES, Fishbein DP, Luceri RM, Ip JH. Amiodarone or an Implantable Cardioverter–Defibrillator for Congestive Heart Failure. The New England Journal of Medicine. 2005;352(3):225–237. doi: 10.1056/NEJMoa043399. [DOI] [PubMed] [Google Scholar]
- 3.Brignole M. Are complications of implantable defibrillators underestimated and benefits over-estimated? Europace. 2009;11(9):1129–1133. doi: 10.1093/europace/eup174. [DOI] [PubMed] [Google Scholar]
- 4.Ardekani S, Weiss RG, Lardo AC, George RT, Lima JA, Wu KC, Miller MI, Winslow RL, Younes L. Computational method for identifying and quantifying shape features of human left ventricular remodeling. Annals of Biomedical Engineering. 2009;37(6):1043–1054. doi: 10.1007/s10439-009-9677-2. [DOI] [PMC free article] [PubMed] [Google Scholar]
- 5.Schmidt A, Azevedo CF, Cheng A, Gupta SN, Bluemke DA, Foo TK, Gerstenblith G, Weiss RG, Marbán E, Tomaselli GF, Lima JAC, Wu KC. Infarct Tissue Heterogeneity by Magnetic Resonance Imaging Identifies Enhanced Cardiac Arrhythmia Susceptibility in Patients With Left Ventricular Dysfunction. Circulation. 2007;115(15):2006–2014. doi: 10.1161/CIRCULATIONAHA.106.653568. [DOI] [PMC free article] [PubMed] [Google Scholar]
- 6.Beg MF, Helm PA, McVeigh E, Miller MI, Winslow RL. Computational Cardiac Anatomy Using MRI. Magnetic Resonance in Medicine. 2004;52(5):1167–1174. doi: 10.1002/mrm.20255. [DOI] [PMC free article] [PubMed] [Google Scholar]
- 7.Turk G, O'Brien J. Shape Transformation Using Variational Implicit Functions. Proc. SIGGRAPH. 1999:335–342. [Google Scholar]
- 8.Vadakkumpadan F, Arevalo H, Prassl AJ, Chen J, Kickinger F, Kohl P, Plank G, Trayanova N. Image-based models of cardiac structure in health and disease. Wiley Interdisciplinary Reviews: Systems Biology and Medicine. 2010;2(4):489–506. doi: 10.1002/wsbm.76. [DOI] [PMC free article] [PubMed] [Google Scholar]
- 9.Matheny A, Goldgof DB. The Use of Three- and Four-Dimensional Surface Harmonics for Rigid and Nonrigid Shape Recovery and Representation. IEEE Transactions on Pattern Analysis and Machine Intelligence. 1995;17(10):967–981. [Google Scholar]
- 10.Goldman R. Curvature formulas for implicit curves and surfaces. Computer Aided Geometric Design. 2005;22(7):632–658. [Google Scholar]
- 11.Ceritoglu C, Oishi K, Li X, Chou MC, Younes L, Albert M, Lyketsos C, Zijl P. C. v., Miller MI, Mori S. Multi-contrast large deformation diffeomorphic metric mapping for diffusion tensor imaging. Neuroimage. 2009;47(2):618–627. doi: 10.1016/j.neuroimage.2009.04.057. [DOI] [PMC free article] [PubMed] [Google Scholar]
- 12.Cordor GW, Foreman DI. Nonparametric Statistics for Non-Statisticians. Wiley; New Jersey: 2009. [Google Scholar]
- 13.Good P. Permutation Tests: A Practical Guide to Resampling Methods for Testing Hypotheses. Springer; 2000. [Google Scholar]
- 14.Wu KC, Gerstenblith G, Guallar E, Marine JE, Dalal D, Cheng A, Marbán E, Lima JA, Tomaselli GF, Weiss RG. Combined Cardiac MRI and C-Reactive Protein Levels Identify a Cohort at Low Risk for Defibrillator Firings and Death. Circulation: Cardiovascular Imaging. 2012 doi: 10.1161/CIRCIMAGING.111.968024. Published online. [DOI] [PMC free article] [PubMed] [Google Scholar]


