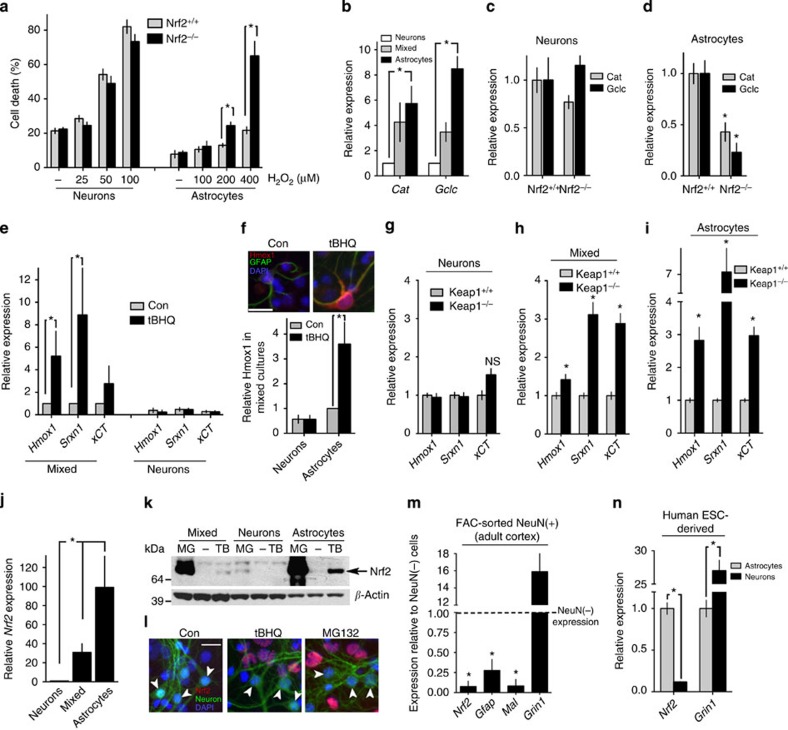
Figure 1. The Nrf2 pathway is weak in cortical neurons.
(a) Impact of Nrf2 deficiency on vulnerability to H2O2 treatment, in DIV10 astrocytes (>98% GFAP+ astrocytes) or neurons (cortical cultures containing >98% NeuN+ neurons, <0.02% GFAP+ astrocytes). Cells were treated with H2O2, fixed after 24 h, DAPI stained and scored for survival/death based on nuclear morphology. *P<0.05, Student's t-test here and throughout unless otherwise stated (neurons: n=4, 700–2000 cells analysed per condition per genotype (PCPG); astrocytes wt n=5, 700–2,000 cells PCPG, ko n=7, 2,100–2,700 cells PCPG). Data are displayed as mean±s.e.m. throughout. (b) Nrf2 target genes Cat and Gclc expression analysed by qRT–PCR, normalized to 18s rRNA, expressed relative to the level in pure neuronal cultures. Mixed cultures: approximately 10% GFAP+ astrocytes, 90% NeuN+ neurons. *P<0.05, Cat n=6, Gclc n=7. (c,d) Impact of Nrf2 deficiency on Cat or Gclc mRNA expression in neurons (c) and astrocytes (d). *P<0.05 compared with wild type (WT); Cat n=4, Gclc n=5. (e) qRT–PCR analysis of Nrf2 target gene (Hmox1, Srxn1 and xCT) expression in response to tBHQ (10 μM, 8 h) treatment of neuronal or mixed cultures. *P<0.05 (n=5–6). (f) Immunohistochemical analysis of Hmox1 expression in tBHQ-treated mixed cultures. *P<0.05 (n=5). Upper: example pictures illustrating elevation of Hmox1 in astrocytes within tBHQ-treated mixed cultures. Scale bar, 25 μm. (g–i) The effect of Keap1 deficiency on Nrf2 target genes. *P<0.05 (compared with WT control (Con), n=8–15). (j) Nrf2 mRNA analysed in parallel cultures of the indicated types. *P<0.05, (n=10). (k) Western blot analysis of Nrf2 expression in different cell types treated with tBHQ (TB; 10 μM) or MG132 (MG; 5 μM) for 16 h. (l) Images of mixed cultures treated as indicated and stained with an anti-Nrf2 antibody (red) and a neuronal marker (Milli-Mark). White arrows highlight lack of Nrf2 induction in neurons. Scale bar, 25 μm. (m) qRT–PCR analysis of Nrf2 and neuronal/non-neuronal marker gene expression in RNA isolated from FAC-sorted adult cortical NeuN+ neurons, expressed relative to levels in NeuN− cells. *P<0.05 (n=4). See Supplementary Fig. 1e. (n) Expression of NRF2 (NEF2L2) and GRIN1 analysed in astrocytes and neurons derived from H9 hESCs. *P<0.05 (n=3). NS, not significant.

