. 2015 Mar 17;13(15):4570–4580. doi: 10.1039/c5ob00371g

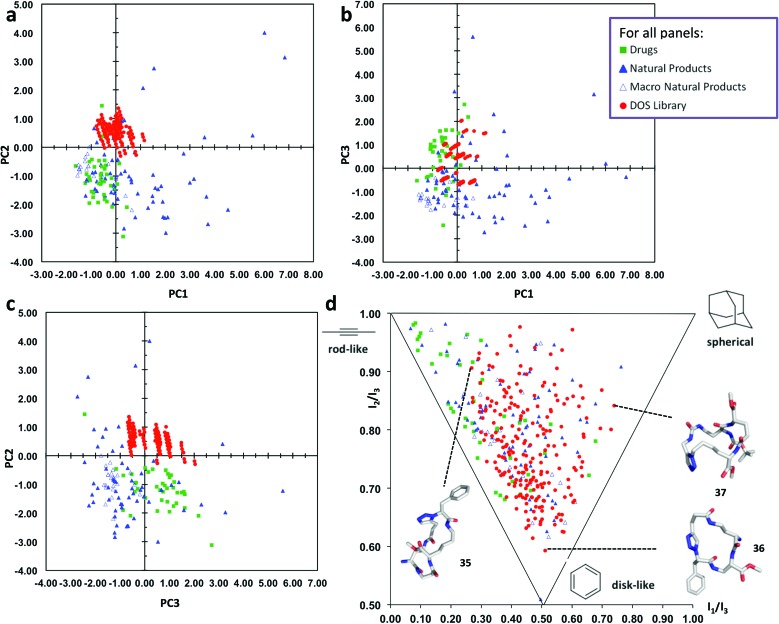
Fig. 3. Comparative PCA and PMI plots of 219 macrocyclic DOS library compounds (“DOS library”, solid red circles), 40 top-selling brand-name drugs (“Drugs”, solid green squares), 60 diverse natural products (“Natural Products”, solid blue triangles) and 24 macrocyclic natural products (“Macro Natural Products”, empty blue triangles). (a) PCA plot of PC1 versus PC2. (b) PCA plot of PC1 versus PC3. (c) PCA plot of PC3 versus PC2. (d) PMI plot illustrating the molecular shape diversity of the DOS library. The lowest energy conformations (molecular shapes) of representative DOS library compounds 35–37 based on each of the three extremes of molecular shape types are shown46 (conformational search by MOE software package47). See ESI for the structures of 35–37 and more details.

Fig. 3