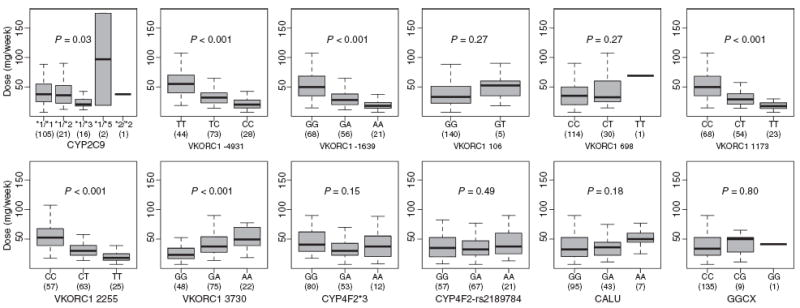
Fig. 1.

Therapeutic warfarin dose according to CYP2C9, VKORC1, CYP4F2, CALU and GGCX genotype. Weekly therapeutic warfarin doses were compared across genotypes. The boxes display the interquartile range of warfarin doses. Whiskers represent observed doses beyond this range with values less than or equal to 1.5 times the interquartile range. The median dose is indicated by the solid black bar. The number of individuals with each genotype is displayed in parenthesis.
