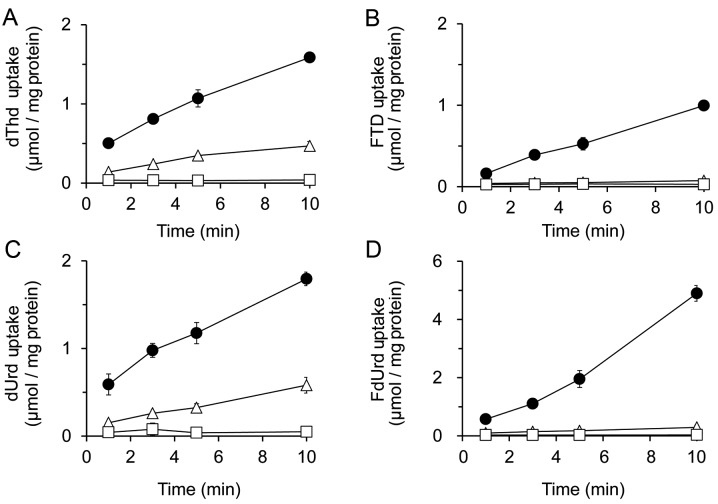
Figure 3.
Comparison of uptake levels of [3H]dThd (A), [3H]FTD (B), [3H]dUrd (C) and [3H]FdUrd (D) and the effects of nucleoside transporter inhibitors. The uptake of 1 μmol/l (1 μCi/ml) dThd, FTD, dUrd and FdUrd was measured for 1, 3, 5 and 10 min by LSC. HCT116 cells were pre-incubated for 10 min at 37°C in transport buffer (pH 7.4) before initiating the uptake assay. Closed circles, open triangles and squares represent cellular uptake with a control, 1 μmol/l NBMPR and 10 μmol/l DPM, respectively. Each result represents the mean ± SD (n=3).

