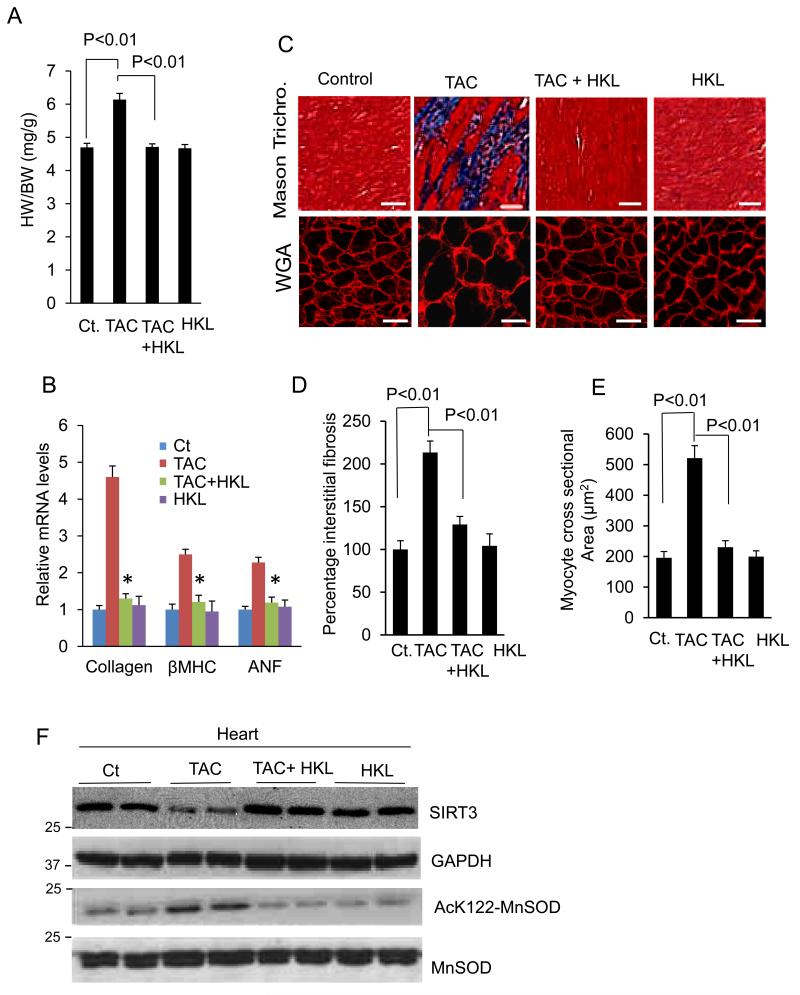
Figure 3. HKL blocks induction of cardiac hypertrophic response in vivo.
(A) Heart weight body weight (HW/BW) ratio of control (Ct), TAC (transverse aortic constriction) and TAC mice treated with HKL, mean ± SE, n = 8-10 mice. (B) Expression levels of collagen-1, β-MHC and ANF mRNA in different groups of mice, mean ± SE, n = 8-10 mice, *P<0.01 compared to TAC alone. (C)Top panel, Sections of hearts stained with Masson’s trichrome to detect fibrosis (blue); scale bars, 20 μm; bottom panel, heart sections stained with wheat germ agglutinin (WGA) to demarcate cell boundaries, scale bars, 10 μm. (D and E) Quantification of cardiac fibrosis and myocyte cross-sectional area in different groups of mice. Mean ± SE, n = 5 mice. For the panels A, B, D and E, ANOVA was applied to calculate the P value. (F) Heart lysate of different groups of mice was subjected to immunoblotting using indicated antibodies. Results of two mice in each group are shown.

