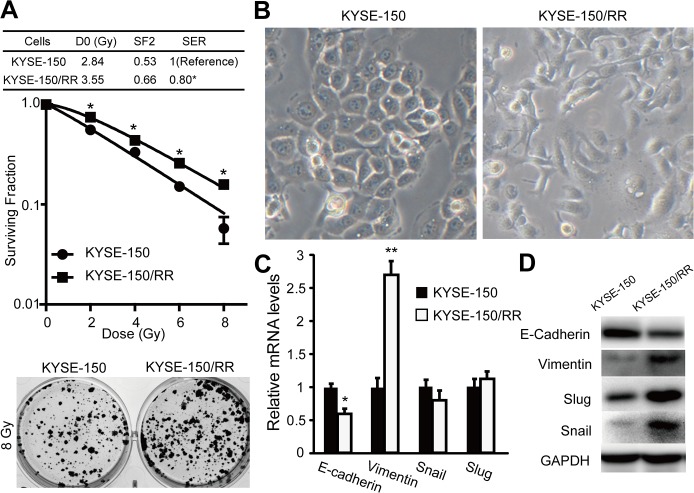
Fig 1. Irradiation induced molecular and phenotypic changes of EMT.
(A) Radiation cell survival curves and the clonogenic figures of the control KYSE-150 cells without irradiation and radioresistance subclone KYSE-150/RR cells. (B) Morphology of KYSE-150 and KYSE-150/RR cells was examined with phase-contrast microscopy. (C) Expression of EMT markers (E-cadherin and vimentin) and transcription repressors of E-cadherin (Snail and Slug) were detected by qRT-PCR, data shown as mean ±SD, *P <0.05. Data represent means with standard deviation from three independent experiments. (D) Representative western blots of E-cadherin, vimentin, Snail and Slug were showed.

