
Fig. 2. Characterization of the multiple inlet single outlet device confirms equal flow through each channel.
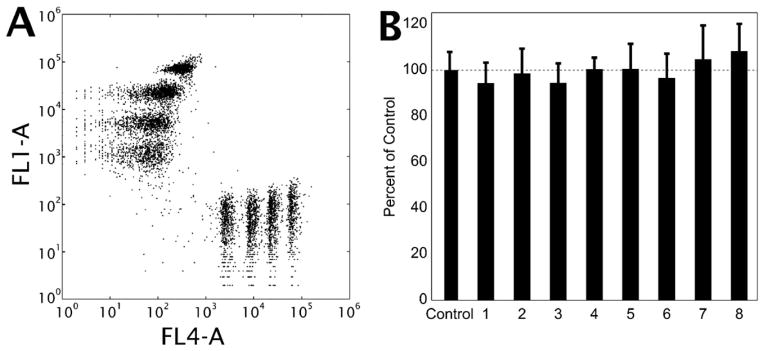
(A) Flow cytometry data indicating the clear identifications of eight distinct peaks in a single sample of eight volumetrically matched standards. Apparent scatter of each population is due to the variability in the background signal of the non-fluorescent channel. (B) Comparison of relative percent of particles in the efflux of the flow device from 15 experiments using 5 different devices (bars are standard deviation, p > 0.05 for all compared to control).