
Fig. 3. Representative micrographs of fluorescently labeled platelet accumulation at the collagen patch.
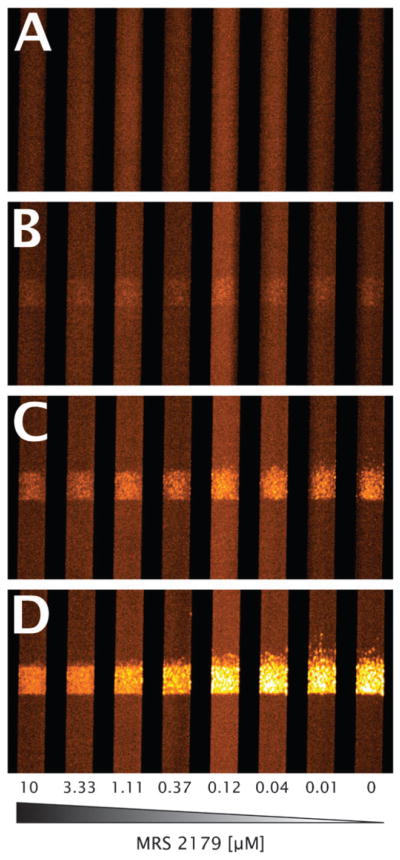
Images are shown at 0 (A), 1 (B), 2 (C), and 5 (D) min of perfusion. Flow is from bottom to top, with concentrations of MRS 2179 decreasing from left to right in human whole blood treated with CTI and PPACK. Channels are 250 μm in width, with reaction zones 250 μm in length. Images are pseudo-colored in order to increase visibility.