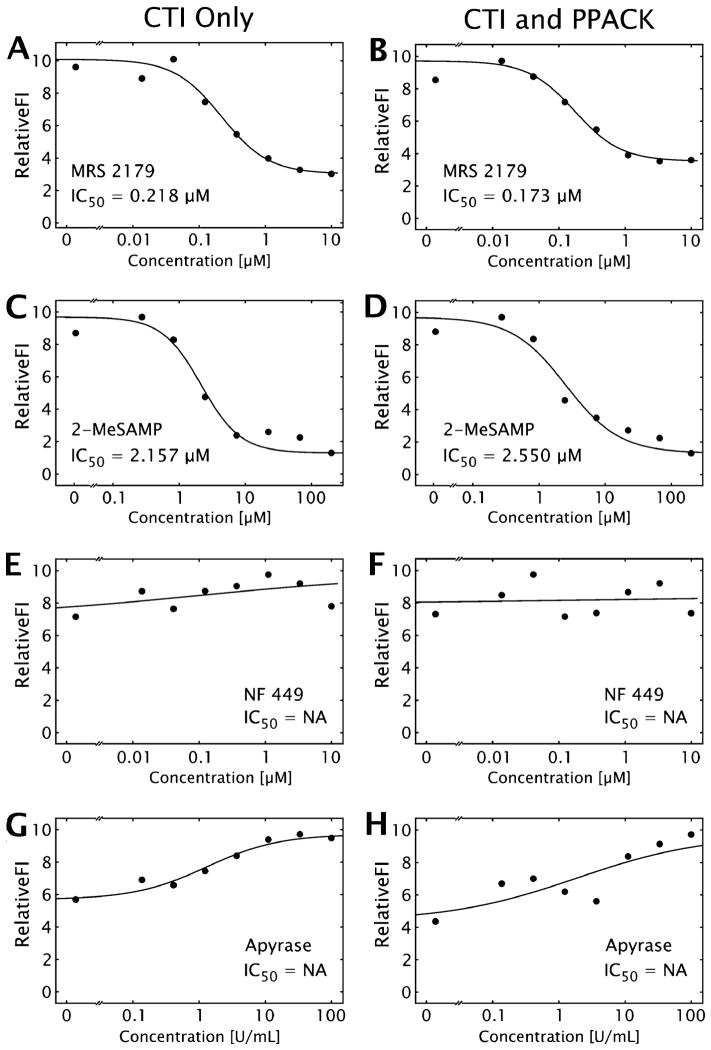
Fig. 4. IC50 curves for three P2-family receptors and apyrase under flow.
Representative IC50 curves for MRS 2179 (A, B), 2-MeSAMP (C, D), NF 449 (E, F), and apyrase (G, H), with (A, C, E, G), or without (B, D, F, H) thrombin inhibition. Measurements are shown as points, while the best fit curve is shown as a solid black line, with the calculated IC50. ‘IC50 = NA’ is shown when no clear dose dependence was displayed.

