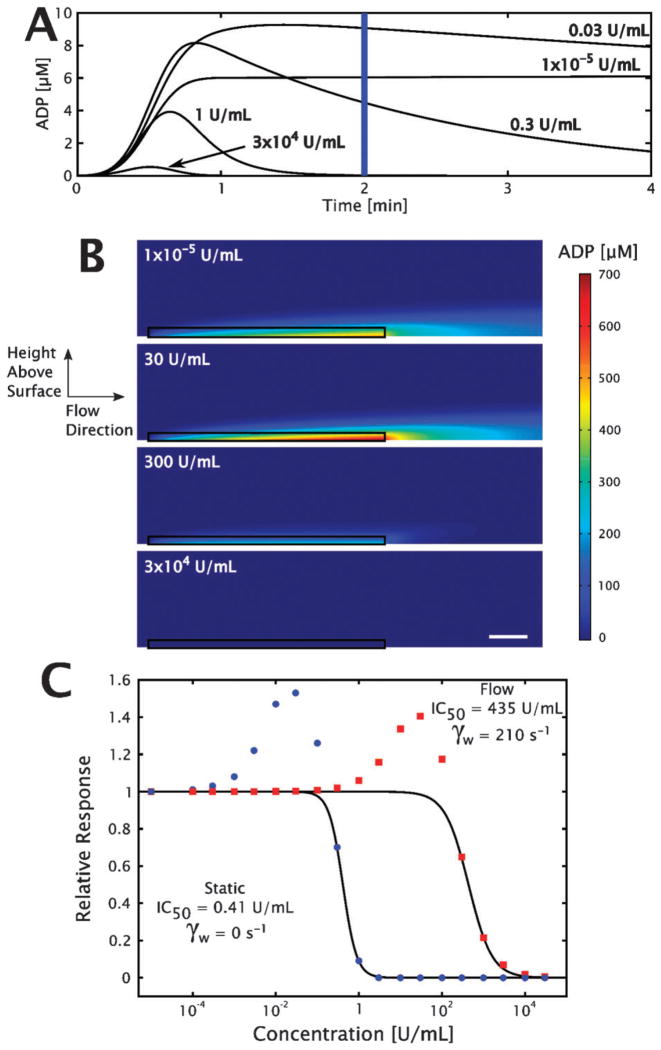
Fig. 5. Results of numerical simulations of apyrase-mediated ADP flux hydrolysis.
The well-mixed aggregometer model ((A), eqn (2)–(4)) calculates the instantaneous ADP concentration for a set of apyrase concentrations in a closed system. (B) Steady-state solutions to the open system (finite element method convection-diffusion-reaction system with eqn (2) and (3)), with flow depicted from left to right in a 30 μm × 400 μm sub-region (scale bar is 50 μm). The 5 μm zone used to calculate the relevant ADP concentration is outlined in black. (C) Dose response curves of apyrase in convection-diffusion-reaction (red squares) and diffusion-reaction (blue circles) systems. The solid lines represent the fit from eqn (1) of the data used to calculate the IC50.

