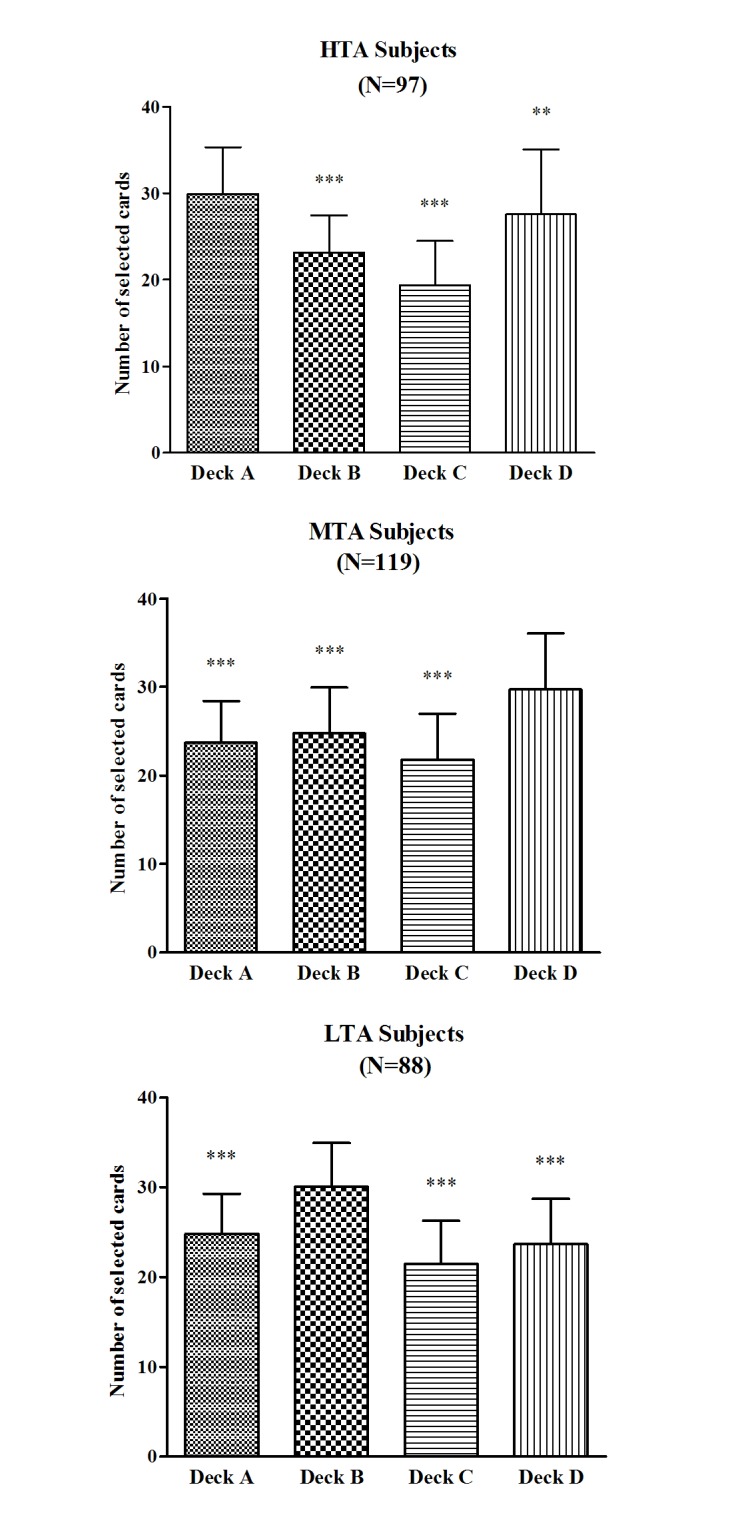
Fig 4. Number of deck selections during the IGT.

Mean number of selections for individual decks A, B, C, and D in the HTA (A), MTA (B), and LTA (C) subjects over 100 picks of cards. *p < .05, **p < .01 and ***p < .001. Means ± SEMs are shown.

Mean number of selections for individual decks A, B, C, and D in the HTA (A), MTA (B), and LTA (C) subjects over 100 picks of cards. *p < .05, **p < .01 and ***p < .001. Means ± SEMs are shown.