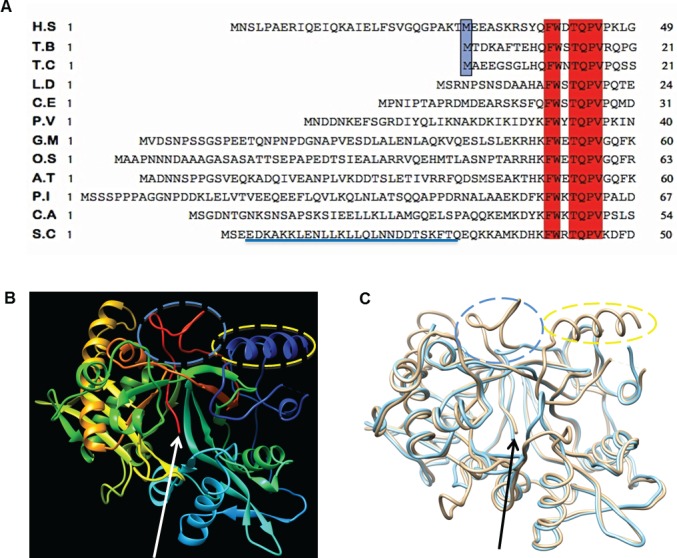
Fig 1. Sequence comparisons of the N-terminal region and structure analysis of NMT.
A, N-terminal amino acid sequence alignment of orthologous NMT from different species. The comparative alignment of H.S (Homo sapiens) sequence is shown with representative organisms T.B (Trypanosoma brucei), T.C (Trypanosoma cruzi), L.D (Leishmania donovani), C.E (Caenorhabditis elegans), P.V (Plasmodium vivax) A5K1A2), G.M (Glycine max), O.S (Oryza sativa), A.T (Arabidopsis thaliana), P.I (Phytophthora infestans), C.E (Candida albicans) and S.C (Saccharomyces cerevisiae). All sequences were obtained from the SwissProt protein database [27] and their accession numbers are listed under “Materials and methods”. The first conserved residues across all sequences are shown in red boxes. The initiator methionine corresponding to Δ28 N-terminal truncation of hNMT1s and its conservation with T.B and T.C NMT is boxed in light blue. The sequence region corresponding to the ordered N-terminal region of Yeast NMT is underlined blue. B, Ribbon diagram representing the locations of ordered N-terminal region and interacting C-terminal portion in three-dimensional structure model of yeast NMT (Protein Data Bank entry 2P6E, chain C). The ordered α-helical and loop region of N-terminus portion are shown in blue and indicated by a dotted ellipsoid (yellow). The location of the insertion in C-terminal portion located between βn′ and βo′ (red) is indicated by the dotted ellipsoid (blue) which is in proximity to the ordered region of N-terminus (shown in blue and encircled by yellow dotted ellipsoid) C, Structural superimposition of the three-dimensional model based structure of yeast and hNMT1s (Protein Data Bank entry 2P6E, chain C and 3IU1, chain A respectively). The light brown and light blue ribbon traces correspond to yeast and human NMT, respectively. The ordered N-terminal region of yeast NMT is indicated by a dotted ellipsoid (yellow) and the differences in the sequence length between βn′ and βo′ regions are indicated by a blue dotted ellipsoid. The arrowhead in B and C indicate the C-terminal tip of the molecule.

