
Fig 1. Whole brain VBM analyses: Controls>Patients.
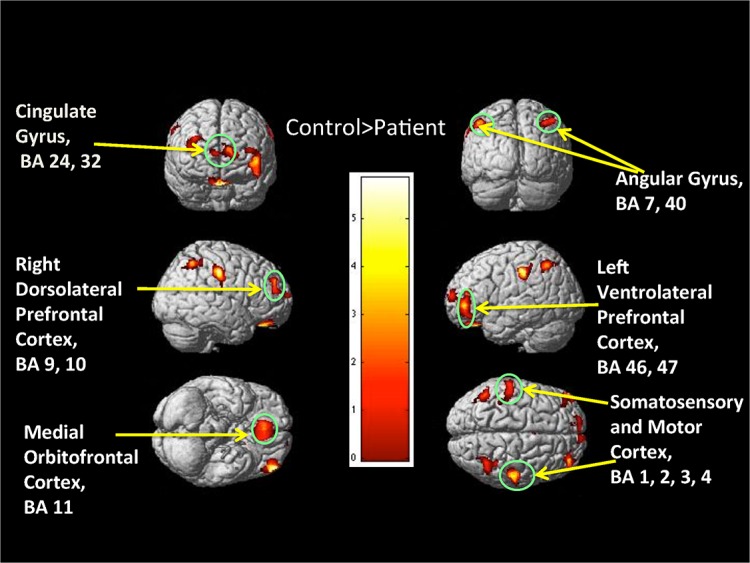
The 3D color map showing various frontal and parietal regions where Controls>Patients. Color bar represents t-value.
Official websites use .gov
A
.gov website belongs to an official
government organization in the United States.
Secure .gov websites use HTTPS
A lock (
) or https:// means you've safely
connected to the .gov website. Share sensitive
information only on official, secure websites.
The 3D color map showing various frontal and parietal regions where Controls>Patients. Color bar represents t-value.