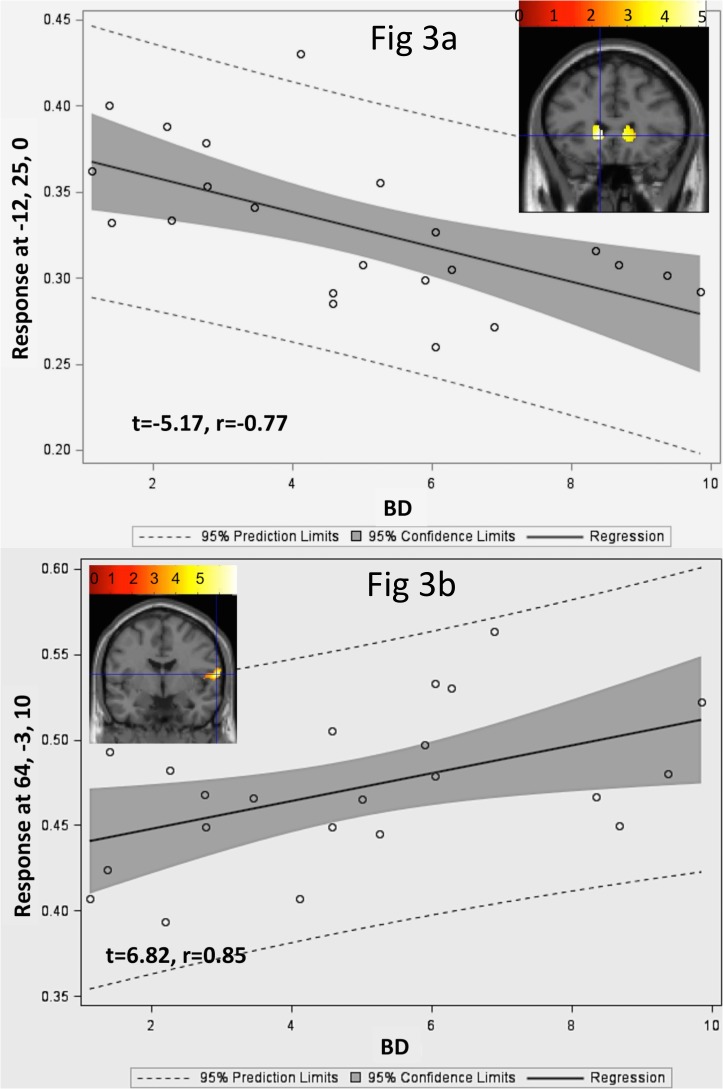
Fig 3. Whole brain regression analyses with BD within patients.
Color map (Y coordinate: 25 mm) in Fig 3a showing negative association between the bilateral striatum and BD score in patients after co-varying for age and IQ. Color map (Y coordinate = -3 mm) in Fig 3b showing positive association between the insula and BD score in patients after co-varying for age and IQ. The crosshairs mark the voxel with maximum association and the regression plots below the color maps show the association between the region and BD score for that voxel with maximum association. A 95% confidence interval will contain the true parameter (slope) with probability 0.95. The prediction interval is an estimate of an interval in which future observations will fall, with probability 0.95, given what has already been observed. Rt = Right.

