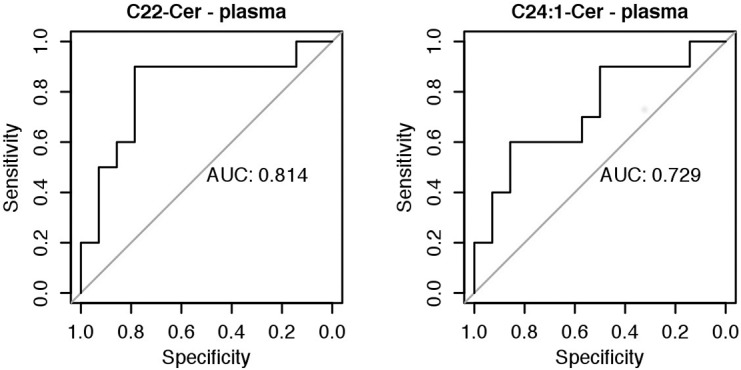
Fig 1. The ROC curves for concentration of sphingolipids in plasma: C22-Cer and C24:1-Cer.

The area under the ROC curve for C22-Cer was 0.814 and for C24:1-Cer it was 0.729. AUC- Area under curve; ROC- Receiver operating characteristic.

The area under the ROC curve for C22-Cer was 0.814 and for C24:1-Cer it was 0.729. AUC- Area under curve; ROC- Receiver operating characteristic.