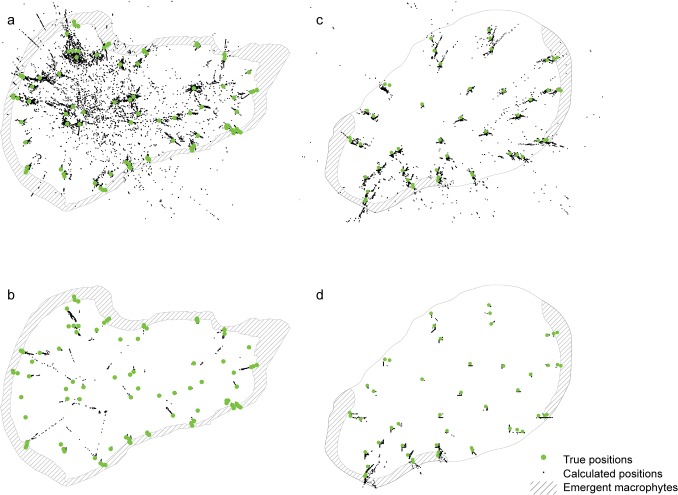
Fig 4. Calculated positions.
Calculated positions from the stationary tests before (raw data) and after (filtered data) applying the Hidden Markov Model. Green points indicate true positions of the stationary tests (NLake1: 90; NLake2: 50) and black dots indicate calculated positions. a: Lake1, raw data (N = 54.653); b: Lake1, filtered data (N = 52,015); c: Lake2, raw data (N = 44.024); d: Lake2, filtered data (N = 43,676).

