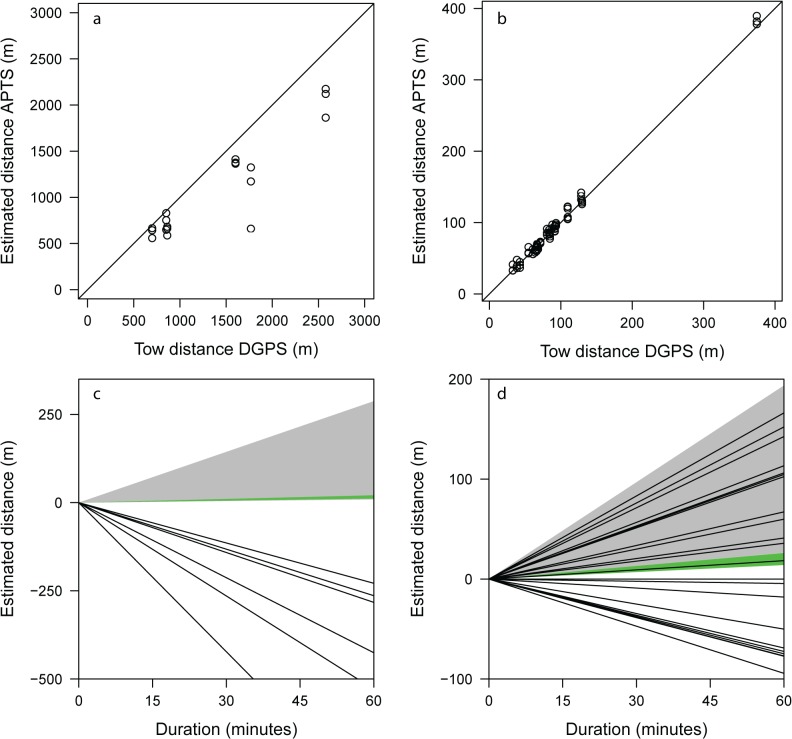
Fig 5. Tow tracks and false movement.
Top row: Total distance of tow tracks estimated by the APTS versus true distance obtained by DGPS (a: Lake1, n = 18 trials (6 tows); b: Lake2, n = 66 trials (22 tows)). Straight line is the 1:1 iso-line added for comparison, i.e., points below and over this line indicate under- and overestimation, respectively, of track length. Bottom row: Accumulated false movement over a 60 minutes period. Filled areas show expected ranges of false movement based on the stationary tests in the open deep water habitat (green; note this area is quite small in both c and d) and the emergent loose habitat (grey). Straight lines represent mean over- or underestimation of track length of each tow (c: Lake1, n = 6 tows; d: Lake2, n = 22 tows).

