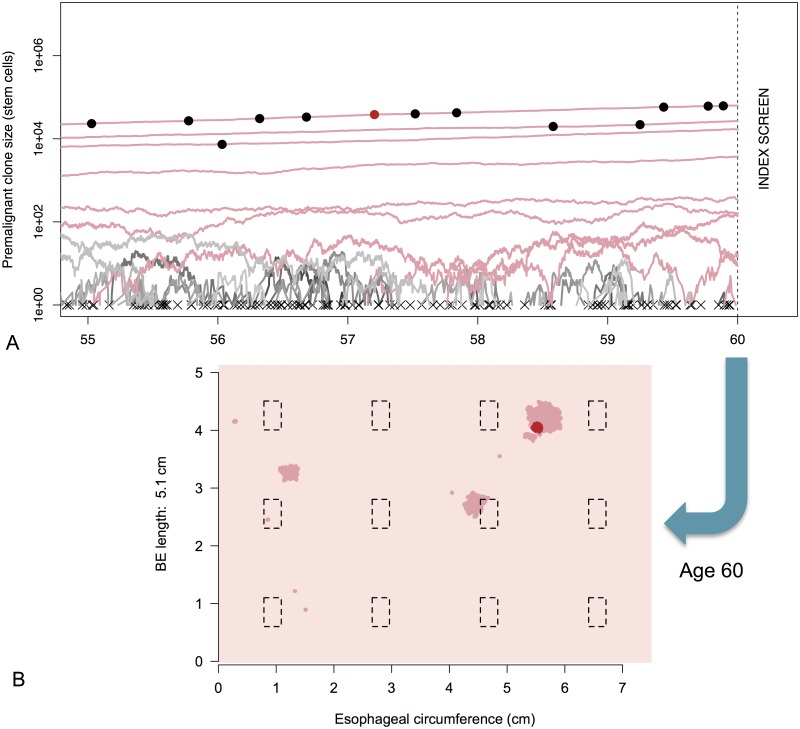
Fig 3. MSCE-EAC tissue module.
A) Premalignant (dysplastic) clone growth stochastic trajectories are depicted for a sample male BE patient from the 1930 birth cohort, beginning five years before time of initial screen at age 60. Most dysplastic cell progenies from a single initiated cell went extinct before examination by endoscopy (trajectories depicted by gray lines and an ‘x’ at time of extinction). The dysplastic clone trajectories that did not go extinct before index screen are shown in dark pink with final sizes intersecting the vertical dotted line. The dots on trajectory lines correspond to times of asymmetric division of a dysplastic cell to produce one dysplastic cell and one malignant cell. Malignant transformations produce both clones that quickly went extinct before age 60 (black dots) and non-extinct malignancies (red dot). B) BE segment at time of screening. Same simulated male patient from (A) with BE of length 5.1 cm. Dysplastic clones (dark pink), malignant clone (red), and biopsies (black dashed rectangles) are pictured at time of biopsy-based screening, age 60. Clone diffusivity parameter is γ = −2.

